Performance Summary
The Performance Summary is a table that lists max and min results from the simulation data. The option in the Simulation Data menu provides these results for all zones within the model, based on the dynamic simulation. However there are ways to produce performance summaries for collections of zones, or even using the results from design day simulations.
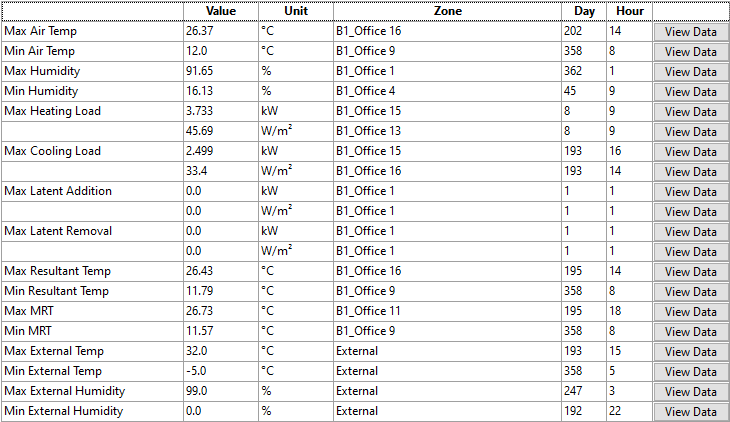
An example of the Performance Summary table.
The Performance Summary table has the following columns:
Result Name - The first column just lists the name of the result, it does not have a header.
Value - The second column is the Value column and just lists the result.
Unit - The third column is the Unit column and reports the unit of the result. For some results, an additional row will appear in the table where the result is reported per unit floor area (in per m²).
Zone - The fourth column is the Zone column and just reports the name of the zone where the result occurs.
Day - The fifth column is the Day column and reports the day the peak result occurs.
Hour - The sixth column is the Hour column and reports the hour of the day the result occurs.
View Data - The final column is the View Data column. This column contains a button which will generate an Output Filter showing the result. Once the Output Filter is generated, it will display the results graph at the given day and hour.
Each Performance Summary table has the following results:
Max Air Temp - The Max Air Temp result displays the maximum dry-bulb temperature for the analysed zones.
Min Air Temp - The Min Air Temp result displays the minimum dry-bulb temperature for the analysed zones.
Max Humidity - The Max Humidity result displays the maximum relative humidity for the reported zones.
Min Humidity - The Min Humidity result displays the minimum relative humidity for the reported zones.
Max Heating Load - The Max Heating Load result displays the maximum heating load for the reported zones. This result gets listed twice, once for the max load and once for the max load per unit area. These two max values can occur in different zones at different hours.
Max Cooling Load - The Max Cooling Load result displays the maximum cooling load for the reported zones. This result gets listed twice, once for the max load and once for the max load per unit area. These two max values can occur in different zones at different hours.
Max Latent Addition - The Max Latent Addition result displays the latent addition (humidification) for the reported zones. This result gets listed twice, once for the max addition and once for the max addition per unit area. These two max values can occur in different zones at different hours.
Max Latent Removal - The Max Latent Removal result displays the latent removal (de-humidification) for the reported zones. This result gets listed twice, once for the max removal and once for the max removal per unit area. These two max values can occur in different zones at different hours.
Max Resultant Temp - The Max Resultant Temp result displays the maximum resultant temperature for the analysed zones.
Min Resultant Temp - The Min Resultant Temp result displays the minimum resultant temperature for the analysed zones.
Max MRT - The Max MRT result displays the maximum mean radiant temperature for the analysed zones.
Min MRT - The Min MRT result displays the minimum mean radiant temperature for the analysed zones.
Max External Temp - The Max External Temp result displays the maximum external temperature from the weather data.
Min External Temp - The Min External Temp result displays the minimum external temperature from the weather data.
Max External Humidity - The Max External Humidity result displays the maximum external relative humidity from the weather data.
Min External Humidity - The Min External Humidity result displays the minimum external relative humidity from the weather data.