CBDM Results Viewer
Without performing another calculation, the CBDM results viewer allows you to:
Change the UDI lux thresholds
Change the weather file
Export hourly lux values
See a weekly, monthly and hourly breakdown
Calculate metrics useful for BREEAM
The CBDM Results Viewer is not available for viewing LEED Option 2 results, as this calculation contains sample data for 4 hours of the year only.
Opening the Viewer
The CBDM results viewer can be accessed via the Utilities menu in the Tas Manager.
The viewer reads “.tcbdm” files.
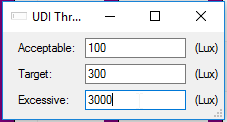
UDI Thresholds Button
The Thresholds button allows you to change the accetable, target and excessive illuminance levels and see the effect on the results without having to perform the CBDM calculation again.
Display Hours Button
The Display Hours button allows you to view the results excluding certain periods from the calculation; for example, you may wish to view the monthly average bar charts but only for hours where the sun is low in the sky.
Warning
Including hours that the calculation was not originally performed for is not possible, so be careful not to include any hours that were not in the original calculation.
You can also change the timestep and see the effect on the results.
Weather Button
The Weather button allows you to change the weather data associated with the calculation. This is useful if you want to compare future weather data with current weather data. Though it is possible to use weather data with a different longitude and lattitude to the original calculation, it is not recommended as the results will be invalid.
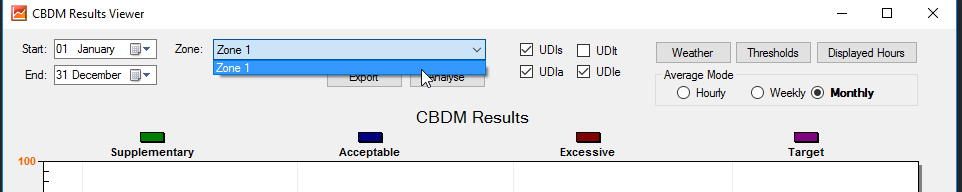
Result Breakdown
You can use the CBDM results viewer to examine when the lux levels for a zone are within the various UDI bands by selecting the zone from the zone selection dropdown and examining the bar chart:
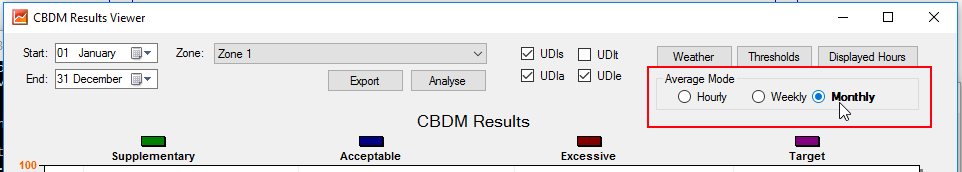
You can choose to see monthly average, weekly average or hourly results:
You can zoom into a particular area by clicking and dragging in the bar chart:
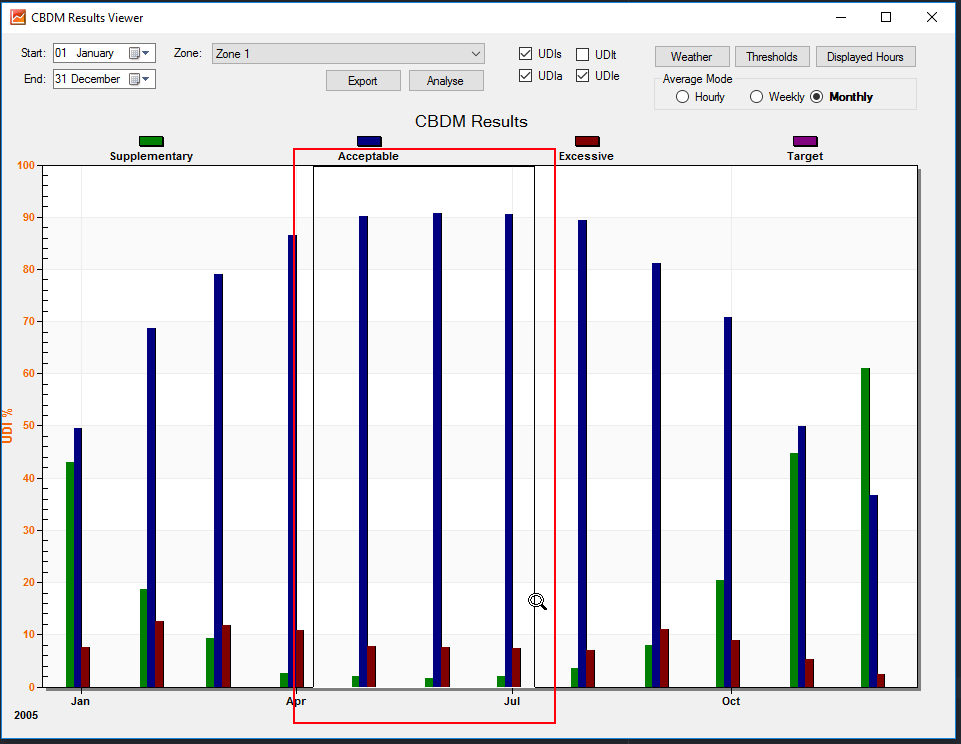
In the example below, we can interrogate the results for a particular date (3rd August):
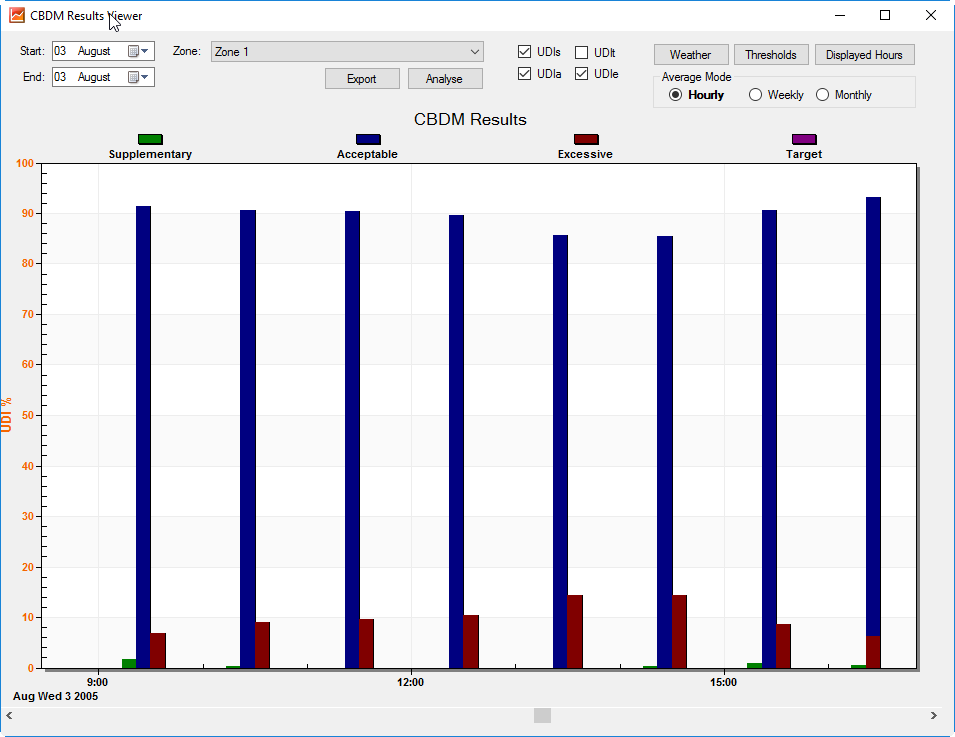
We can see that some proportion of the points are almost always excessively bright, regardless of the hour of the day. We can also see that there are very few points that not lit well enough.
Exporting Data
To export annual data , press the Export button:
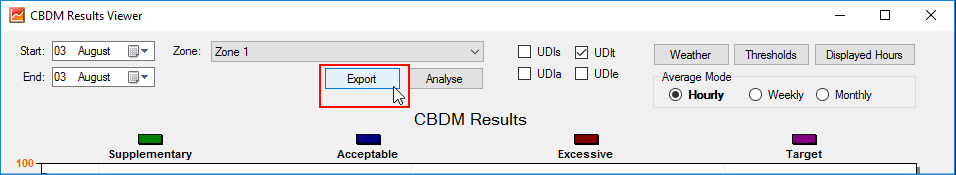
The following information is exported:
Average lux
Average Daylight Factors
Minimum Lux (individual point)
Maximum Lux (individual point)
The results will be exported according to the timestep currently selected in the Displayed Hours window.
Other Metrics (e.g. BREEAM)
Clicking the Analyse button allows you to calculate the Average Daylight Illuminance and Minimum Daylight Illuminance in terms of lux levels and a target number of hours per year.
For example, for certain BREEAM credits its useful to determine what percentage of the space receives at least X lux for Y hours per year or more.
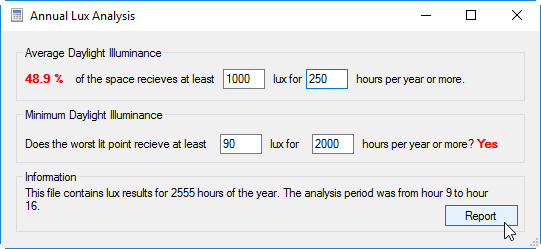
A report of this information can be generated by pressing the Report button on this dialog.