Performing a Calculation
This section will guide you through performing a CBDM calculation on a file.
Launching the CBDM wizard
1. Open your prepared Tas3D file and press “Analysis>> Climate Based Daylight Modelling”:
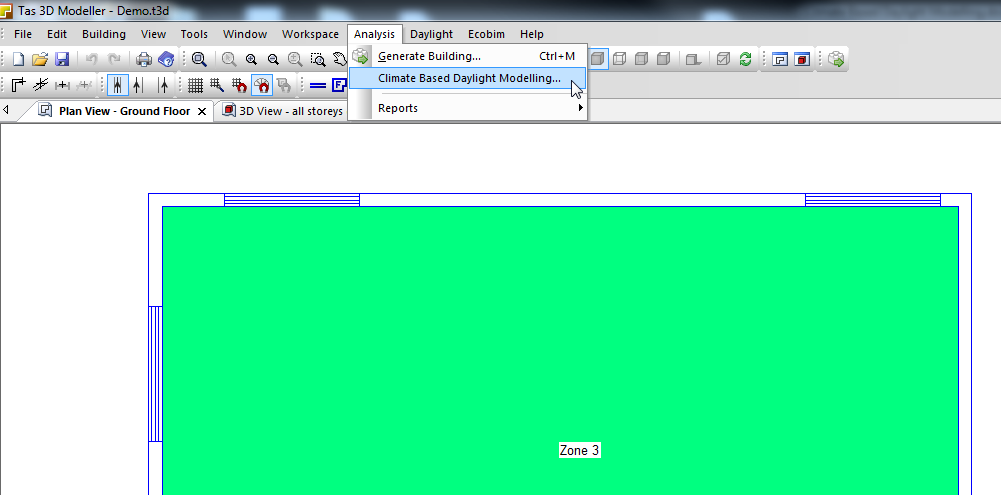
The peer to peer wizard will open.
Press Next to continue to the Calculation Inputs page.
Calculation Inputs
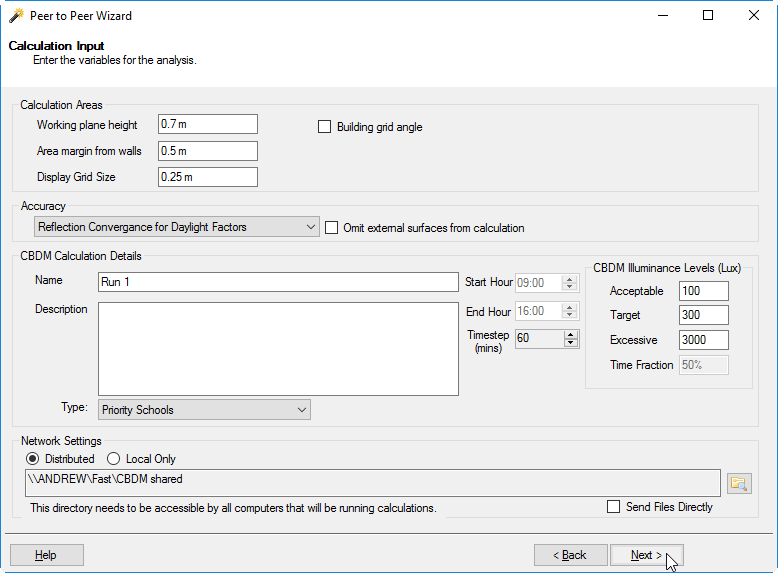
2. Choose a working plane height, area margin from walls and display grid size appropriate for the spaces you will be analyzing;
Working Plane Height - Typically, desk height.
Display Grid Size - For EFA FOS, the grid size should be 0.25m or less.
Area Margin from Walls - For most spaces, the 0.5m boundary around the edge of the room can be excluded unless it will be regularly used, for example, in science classrooms.
3. Choose the calculation accuracy. For most calculations, this will be Reflection Convergence for Daylight Factors, though lower accuracies can be used for a faster but less accurate calculation.
4. Enter the definitions for acceptable, target and excessive lux values. A grid point result will be classified depending on its lux level:
If the lux level is less than acceptable, the point is insufficiently lit.
If the lux level is greater than acceptable but less than excessive, the point is acceptably lit.
If the lux level is greater than target but less than excessive, the point is lit as desired.
If the lux level is greater than excessive, the point is too bright.
For more information, please see Understanding the results:
5. Choose the calculation type; the options are ‘priority schools’, ‘LEED Option 2’ and ‘other’.
Priority Schools
The time fraction and start/end hour for the calculation cannot be changed for a priority schools calculation, as these numbers are fixed as part of the priority schools requirement.
LEED Option 2
Performs the calculation to obtain the LEED option 2 daylighting credits. This calculation assesses the percentage of floor area that recieves between 300 and 3,000 lux for 9am and 3pm, on a clear sky day near to the equinox.
Other
This option is useful for requirements such as BREEAM. You will be able to change the time fraction (used for daylight autonomy) and the start time and end time of the calculation. If you are trying to show that the space recieves a certain illuminance for a certan number of hours per year, it is important to ensure that the start hour and end hour result in an analysis period greater than that target number of hours.
6. If required, you can change the default timestep used for the calculation. As the weather data used for the calculation is hourly, the effect of this is to account for the movement of the sun during the hour.
7. Enter a ‘calculation name’ on the calculation input page. You can use the description box to help you remember details about a calculation.
8. Change the Network Settings to choose how the calculation is performed.
Distributed
Performs the calculation using other computers with Tas installed on the network. When performing distributed calculations, intermediate files can either be sent directly to other computers (via the checkbox), or stored in a shared working directory on the network.
Local
Performs the calculation using only your computer, without any network requirements.
Note
If you do not have a shared network directory available, you will only be able to perform the calculation using one computer.
Press Next to continue to the weather data page
Weather Data
9. Select a weather file that is appropriate for the location of the building:
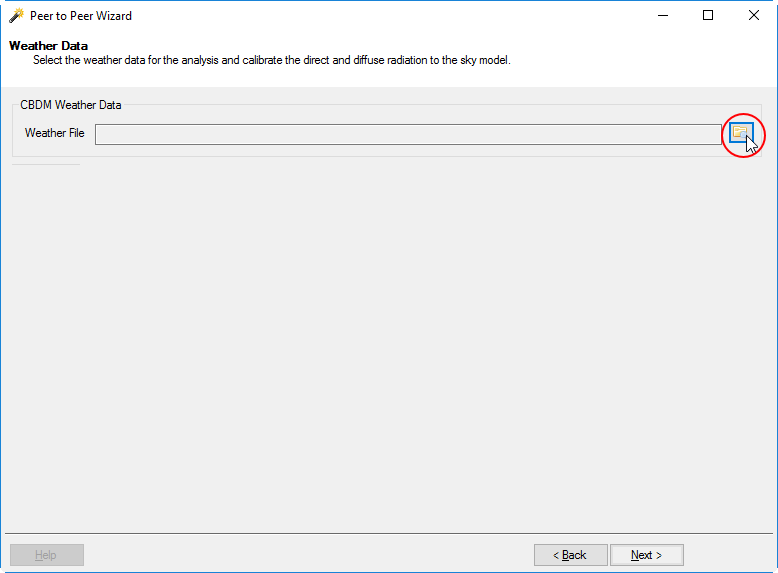
Press Next to continue to the Select Zones page
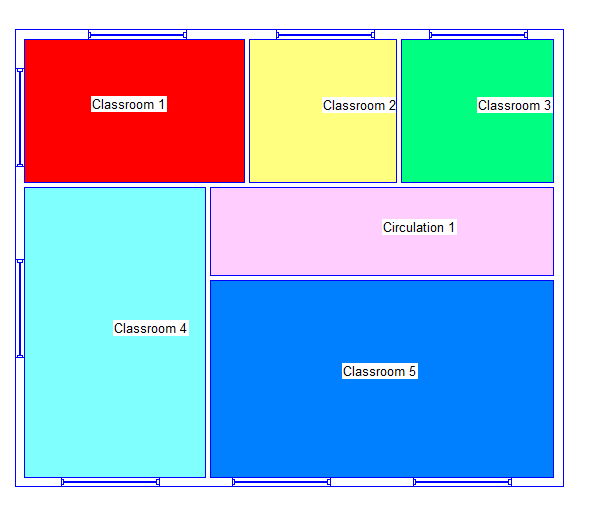
Select Zones
10. Right click on each zone to be included in the calculation and click ‘Include’.
If you are performing the calculation on a large number of spaces, consider whether you can rationalize the zone selection and use one representative zone for several similar zones. For example, classrooms 2 and 3 below have the same orientation, similar areas and the same windows. Their results will be very similar, if not identical.
Press Next to continue to the Perform Calculation page.
Perform Work
If you selected the Distributed network option in step 7, the wizard will look like this:
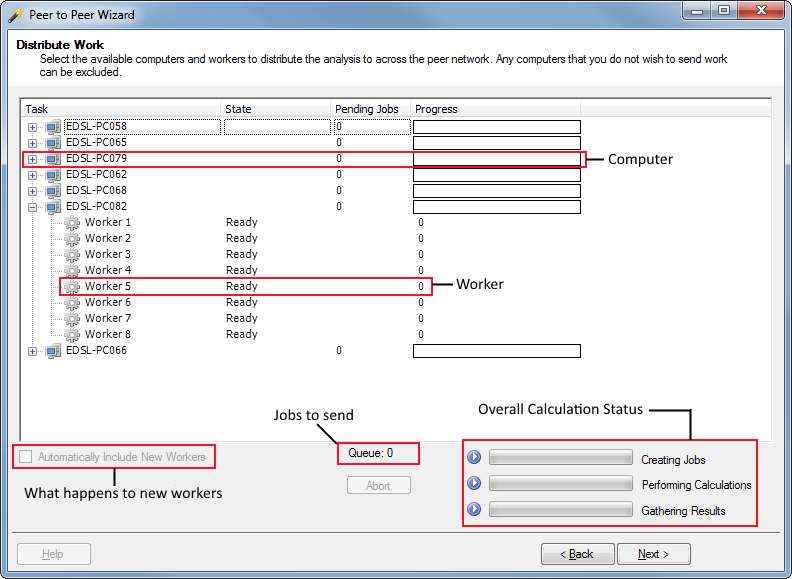
This page of the wizard lists all of the computers available for a calculation: * Each computer on your network running the tray application will appear in this list. * Each computer can have up to 1 worker per logical processor core, e.g. an Intel i5 quad core processor can have up to 4 workers. An Intel i7 quad core with hyper-threading enabled can have up to 8 workers. * If a worker can be used for a calculation, its status will say ‘Ready’.
There is the option to right click on workers in the list and use the context menu to exclude them from being used for the calculation if required.
Note
If your colleague’s computers appear on this list, please ask them if they mind you running a calculation using their machine.
11. Press Next to start the calculation.
The ‘Overall Calculation Status’ bars can be used to check the progress of the calculation.
The queue represents jobs that are waiting to be sent to workers.
If new workers become available after a calculation has been started, you can choose whether they will automatically be sent work by checking the ‘Automatically Include New Workers’ checkbox. They can be excluded from the calculation at any time, and they will finish the calculation they are currently working before being excluded.
When the calculation is finished, press Next.
Saving Data for Detailed Analysis
12. This page lets you save a ‘tcbdm’ file for detailed analysis later.
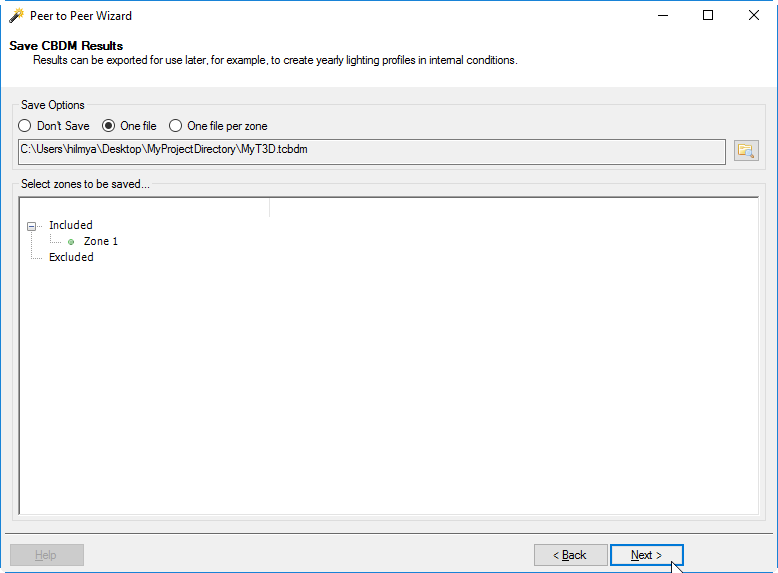
The file opens in the CBDM Results Viewer, and allows you to examine hourly lux results as well as perform calculations for certain BREEAM criteria. It even lets you change the weather data associated with the calculation, providing the longitude and lattitude are the same. This can be useful for analysing future weather data.
It is highly recommended that you save this file, as once you close the wizard, it cannot be recreated without performing the calculation again.
Note
This page is unavailable when performing LEED option 2 calculations.
Press Next to generate a report
Report
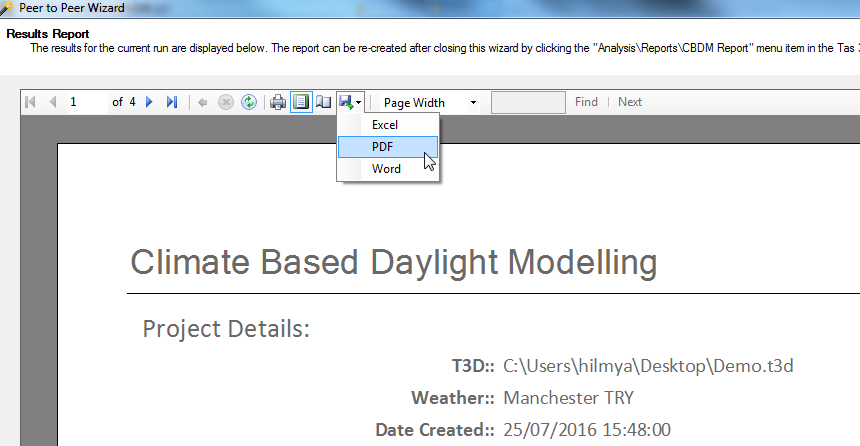
A climate based daylight modelling report will be automatically generated by the wizard. This report:
Gives a table of results for all included zones.
Includes a summary of the calculation inputs.
Gives a zone-by-zone breakdown of each result and the surface reflectance and transmittance values that are defined in the model.
This report can be saved to the following formats:
Microsoft Excel Document
PDF document
Word Document
Press Finish to close the wizard.
For more information about generating a report, please see Generating a Report: