Cooling Sizing Report
The Cooling Sizing Report is produced when a cooling design day has been created. The report has 5 distinct sections:
1. Project Details
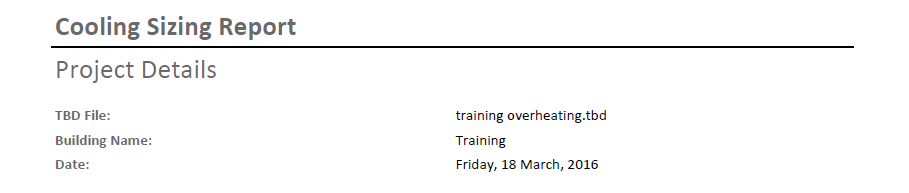
Figure 3.2.1: The Project Details section of the Cooling Sizing Report.
The Project Details section of the report provides some details on the report, including the name of the TBD file and the date the report was generated.
2. Weather Data
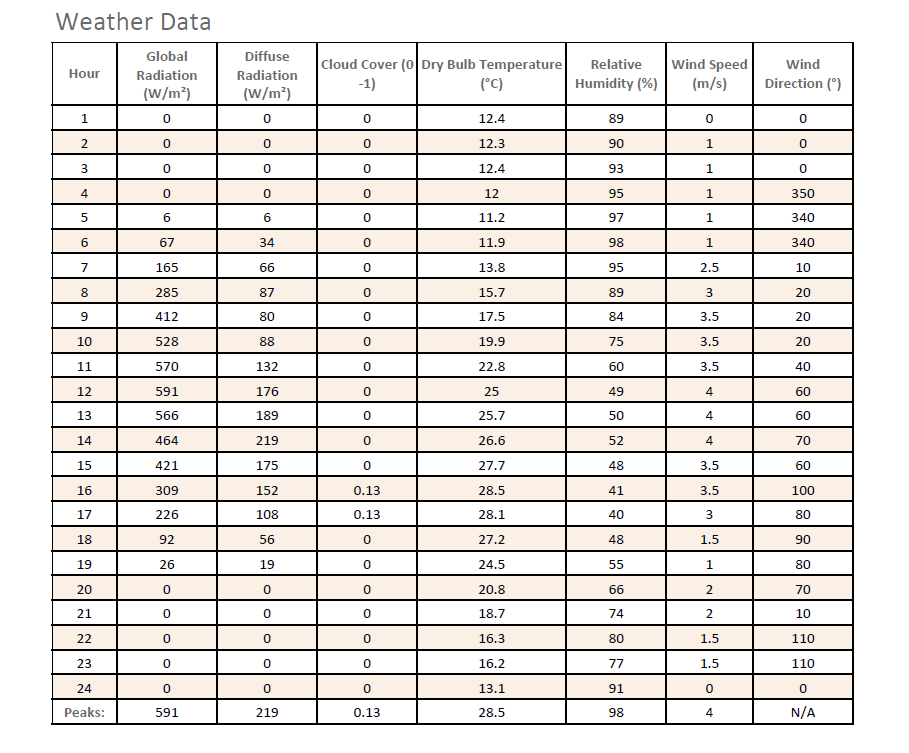
Figure 3.2.2: The Weather Data section of the Cooling Sizing Report.
The Weather Data section reports the weather data used during the cooling design day in a tabular format. For each hour of the cyclic day the: global radiation, diffuse radiation, cloud cover, dry bulb temperature, relative humidity, wind speed and wind direction are reported, with the final row of the table reporting the peak value for each field. Please note that no peak is reported for the Wind Direction column as it is not applicable.
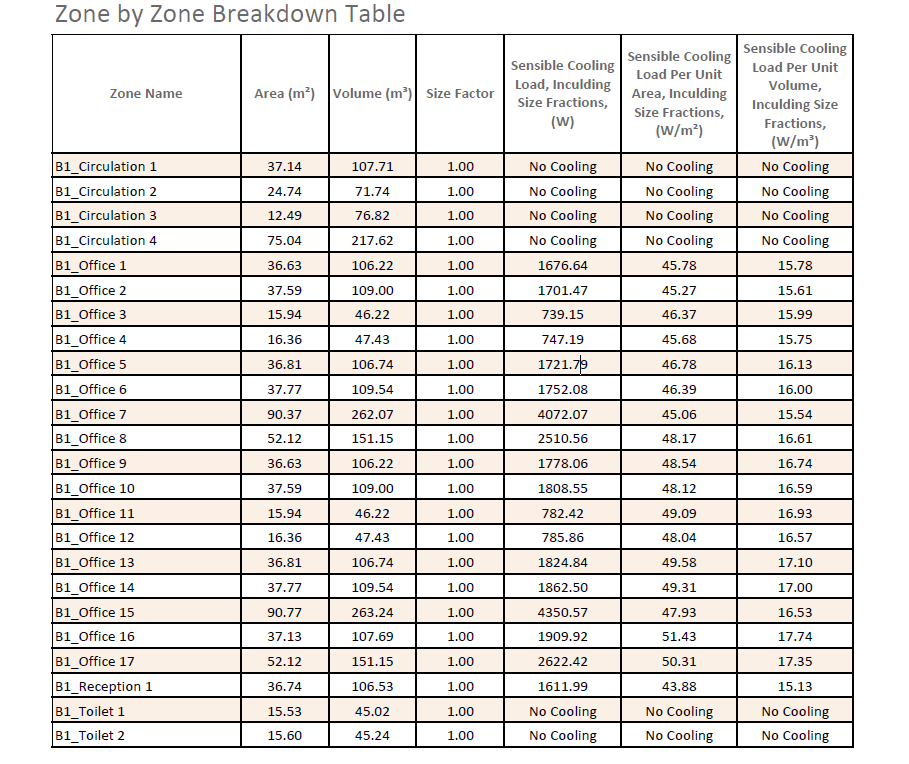
3. Zone Breakdown
The Zone Breakdown section is the largest section of the report, as this section of the report is repeated for each zone. It starts of by listing the zone in question, along with its area and volume. After that, there is a table reporting the internal gains and thermostat used for that zone during the cooling design day calculation.
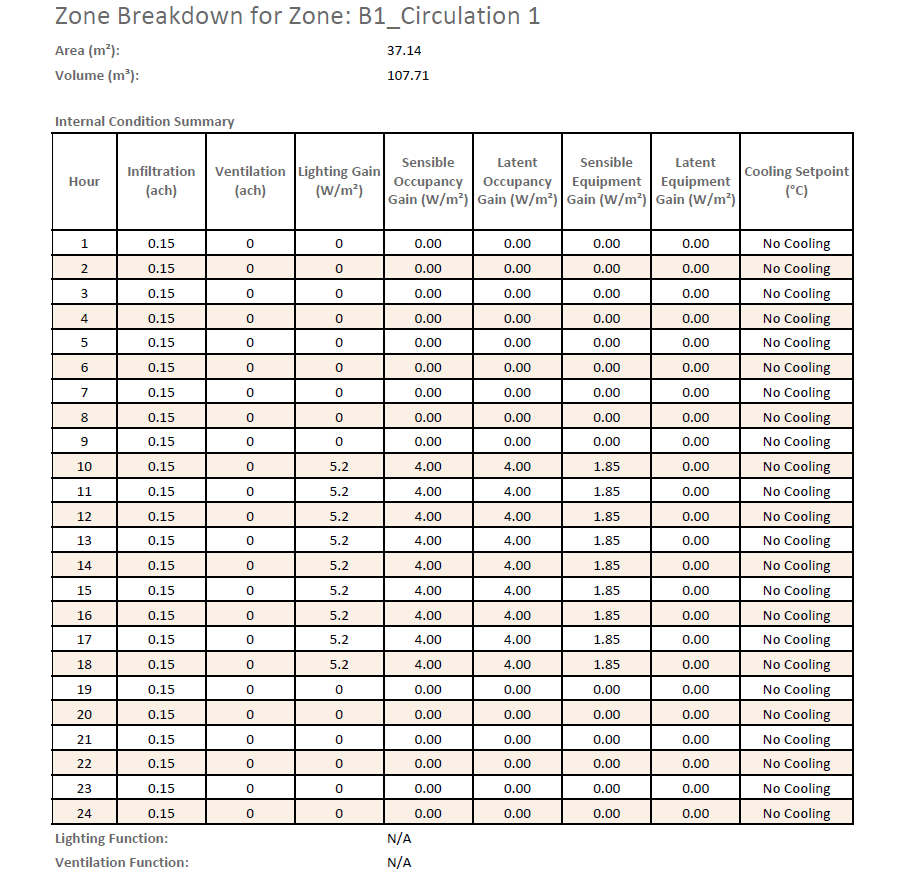
Figure 3.2.3: The first part of the Zone Breakdown section of the Cooling Sizing Report.
The table has columns listing the: infiltration rate, ventilation rate, lighting gain, sensible occupancy gain, latent occupancy gain, sensible equipment gain, latent equipment gain and cooling setpoint for each hour of the cyclic day.
If a function is used in any hour for either the lighting gain or ventilation rate fields, the report will state the word “function” for that hour. The function string used will be reported under the table.
Below this, another table provides the sensible energy breakdown during the cooling design day. The table lists the: solar gain, lighting gain, infiltration and ventilation gain, air movement gain, building heat transfer gain, external conduction, sensible occupancy and equipment gains, and required sensible cooling load.
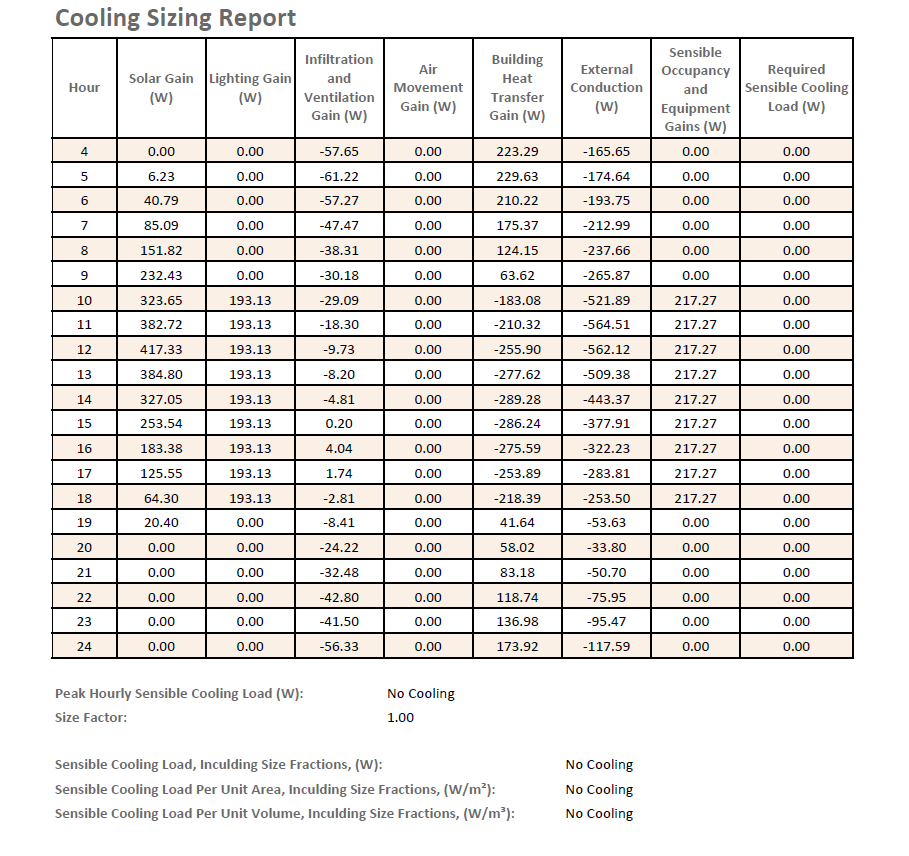
Figure 3.2.4: The second part of the Zone Breakdown section of the Cooling Sizing Report.
Underneath the Sensible Energy Breakdown table, the required sensible cooling load is reported, along with the size factor. Finally the sensible cooling load, including the size fraction is reported.
4. Building Summary
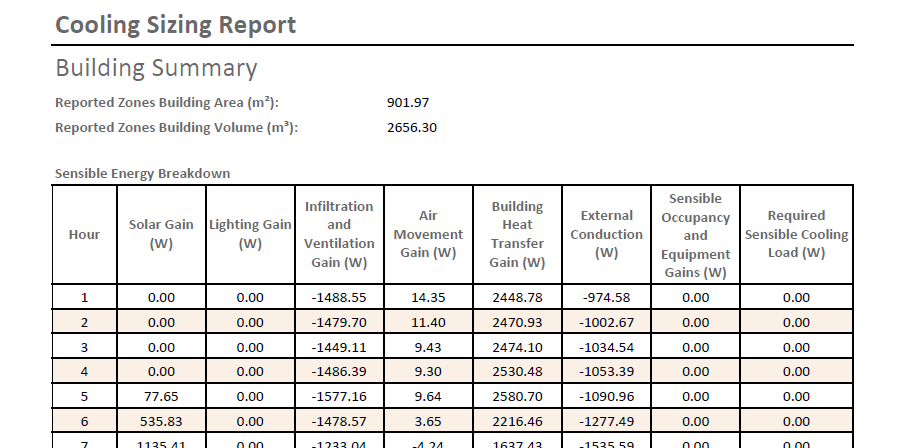
Figure 3.2.5: The Building Summary section of the Cooling Sizing Report.
The Building Summary section provides a breakdown of the cooling loads for the building. At the top of this section, the area and volume of all reported zones in the model is displayed. Then the sensible energy breakdown for the building as a whole is displayed. Underneath the table, the sum of the peak zone cooling load, including size fractions, is reported for the building as a whole. Please note that even if the size fraction for every zone is equal to 1, the sum of the peak zone cooling loads will be greater than or equal to the peak sensible cooling load from the sensible energy breakdown table. This is because zones may have their cooling load peak in different hours.