Cooling Summary Report
The Cooling Summary Report is produced when 2 or more cooling design days have been created. The report has 4 distinct sections:
1. Project Details
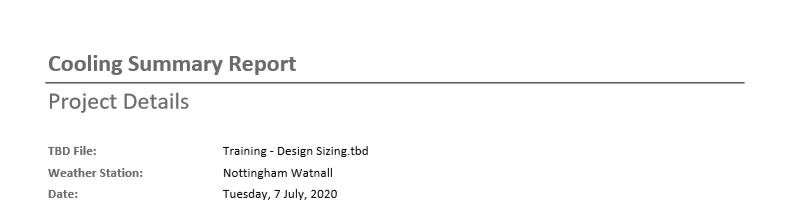
Figure 3.1.1: The Project Details section of the Cooling Summary Report.
The Project Details section of the report provides some details on the report, including the name of the TBD file, weather station used and the date the report was generated.
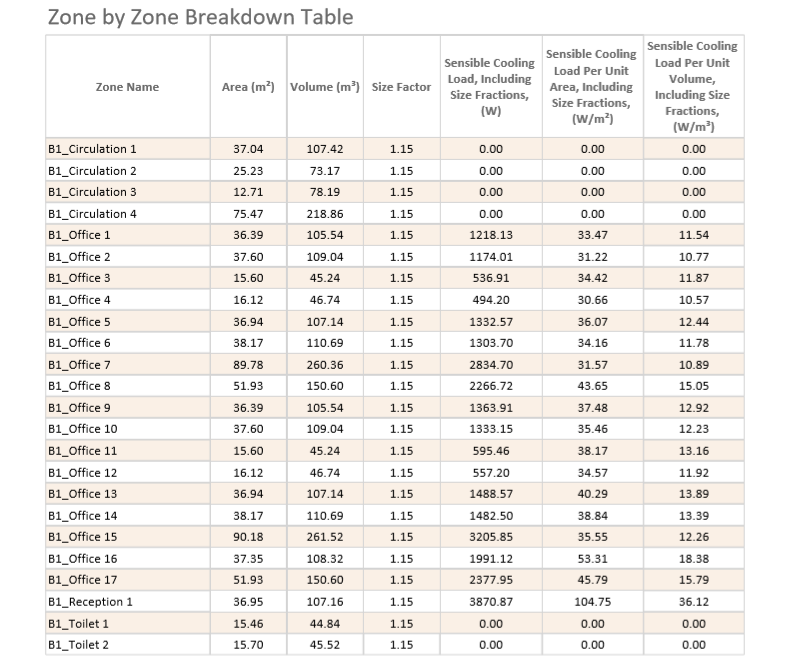
2. Zone Summary
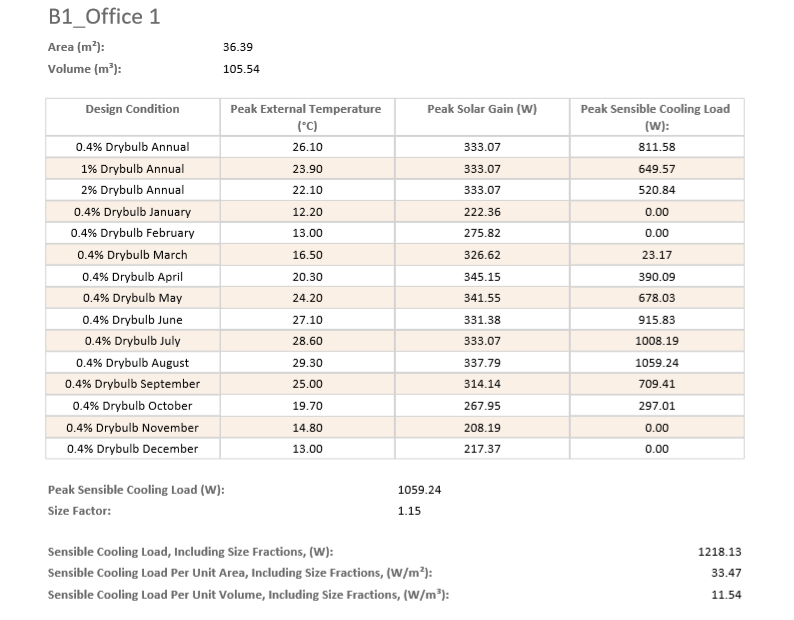
Figure 3.1.2: The Zone Summary section of the Cooling Summary Report.
The Zone Summary section gives a breakdown, for each design condition, of the peak results. It starts off by stating the area and volume of the zone. Below that, a table lists the peak external temperature, peak solar gain and peak sensible cooling load for the zone under each design condition. Underneath the table, the peak sensible cooling load from all design conditions is reported, along with the size factor. Finally the peak sensible cooling load, including the size fraction is reported.
3. Building Summary
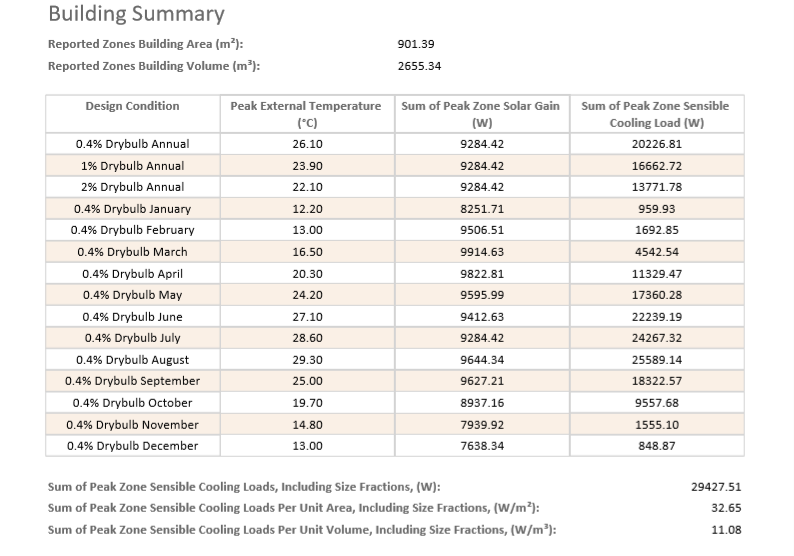
Figure 3.1.3: The Building Summary section of the Cooling Summary Report.
The Building Summary section provides a breakdown, for each design condition, of the peak results. At the top, it reports the total floor area and volume for all reported zones. Then, in the table, it reports the peak external temperature along with the sum of each zone’s peak solar gain and sensible cooling load. Underneath the table, the sum of the peak cooling load from these design conditions, including size fractions, is reported for the building as a whole.