Select Design Day Weather Data - ASHRAE
The Select Design Day Weather Data - ASHRAE page will only appear in the wizard if the 2017 ASHRAE Fundamentals Weather Data option is selected on the Select Design Day Type page. This page is split into 3 separate tabs.
Weather Station Selection
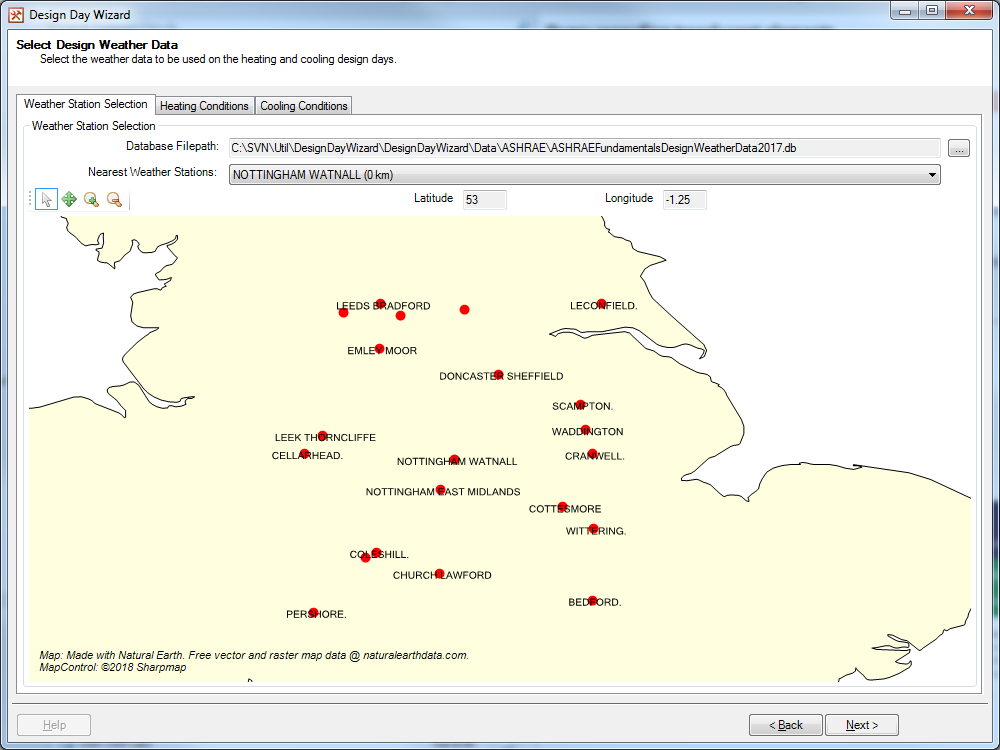
Figure 2.2.1: The Weather Station Selection tab.
The 2017 ASHRAE Fundamentals Weather Data contains weather data for 8118 locations around the world. The Weather Station Selection tab helps the user decide which weather station to use.
At the top of the tab is the Database Filepath field, which should point to the ASHRAEFundamentalsDesignWeatherData2017.db. This database can be found in the Database folder of the Tas Data directory, and by default the software will look here to find the database. So if the user moves this directory then they will need to correct this path. If the database file cannot be found then the user will not be able to progress and select a weather station.
Once the database has been found, the wizard will find weather stations near the building, using the latitude and longitude of the current weather data in the TBD file. These weather stations will then be displayed in the Nearest Weather Stations dropdown menu, and also on the map, while the latitude and longitude of the current weather data are displayed in the Latitude and Longitude fields.
On the map, each red dot represents a weather station, with the name of the station also appearing if it doesn’t clash with another weather station’s name. A green dot can also appear on the map and it represents the location of the weather data in the TBD file. If a weather station is in the same location as the weather data, only the weather station (red dot) will be shown.
In the top left corner of the map there is a tool bar with the following options:
 Select Tool - With this tool selected, clicking on any weather stations
displayed on the map will change the selected weather station.
Select Tool - With this tool selected, clicking on any weather stations
displayed on the map will change the selected weather station.
 Pan Tool - With this tool selected, the user will be able to pan around
the map by clicking and dragging on the map. This tool can be selected by holding
down the Ctrl key on the keyboard.
Pan Tool - With this tool selected, the user will be able to pan around
the map by clicking and dragging on the map. This tool can be selected by holding
down the Ctrl key on the keyboard.
 Zoom In - With this tool selected, the user will be able to zoom in
by clicking and dragging on the map. The user can also zoom in using the scroll
wheel on their mouse.
Zoom In - With this tool selected, the user will be able to zoom in
by clicking and dragging on the map. The user can also zoom in using the scroll
wheel on their mouse.
 Zoom Out - With this tool selected, the user will be able to zoom out
by clicking and dragging on the map. The user can also zoom out using the scroll
wheel on their mouse.
Zoom Out - With this tool selected, the user will be able to zoom out
by clicking and dragging on the map. The user can also zoom out using the scroll
wheel on their mouse.
Along with using the map to select the weather station, the Nearest Weather Station dropdown can be used as well. The dropdown is ordered such that the closest station is at the top of the dropdown menu.
Heating Conditions
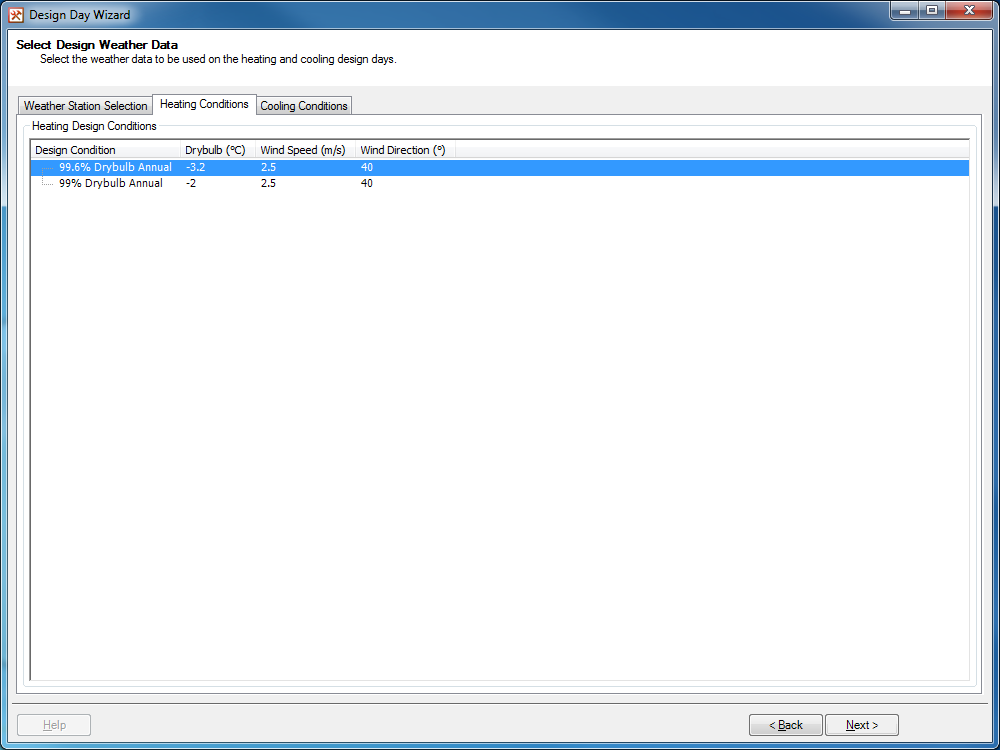
Figure 2.2.2: The Heating Source tab.
The Heating Conditions tab will only appear on this page if the Create a Heating Design Day option is selected on the Select Design Day Type page. From this tab, you will setup the external weather data to be used on the Heating Design Day.
The bulk of this tab is taken up by a table listing all of the possible design conditions. The table has the following columns:
Design Condition - This column lists the name of the design condition. For heating conditions this will normally be the annual 99% or 99.6% drybulb design conditions.
Drybulb - This column lists the external drybulb temperature to be used in the steady state heating calculation. Depending on the unit system selected in Tas, this will be displayed in Celsius or Fahrenheit.
Wind Speed - This column lists the external wind speed to be used in the steady state heating calculation. Depending on the unit system selected in Tas, this will be displayed in metres per second, foot per second or miles per hour.
Wind Direction - This column lists the external wind direction to be used in the steady state heating calculation. This will always be displayed in degrees from north; i.e. 0 is due north, 90 is due east.
Left clicking on a design condition will select the design condition. Once a design condition is selected, it’s row in the table is highlighted blue. Multiple design conditions can be selected by holding down the Ctrl key while making your selections.
Cooling Conditions
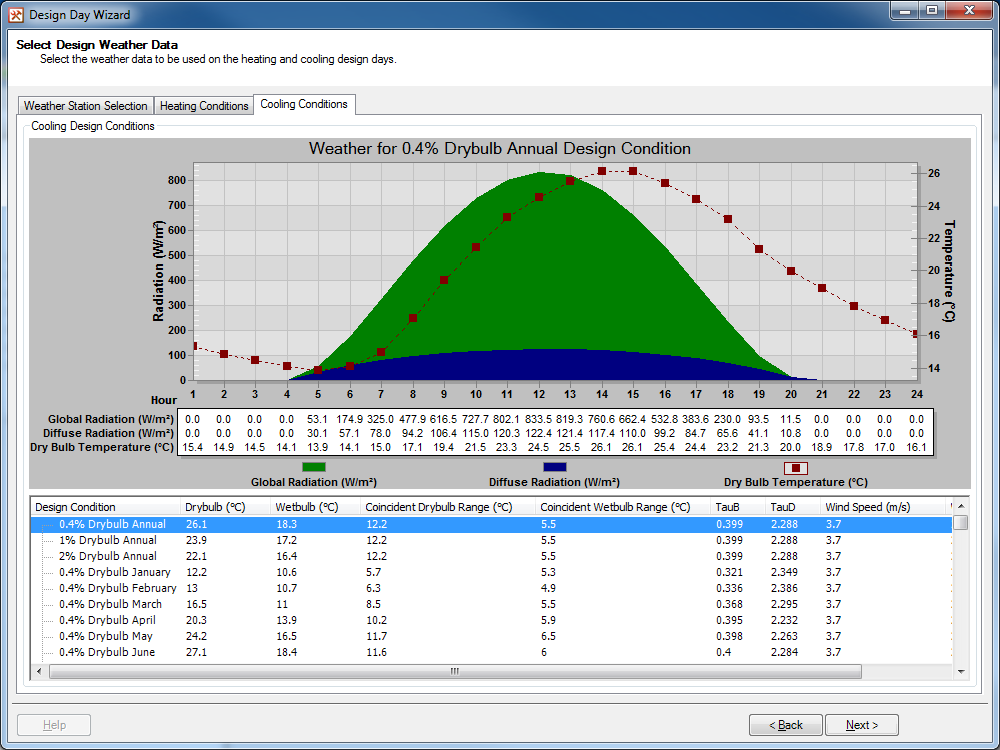
Figure 2.2.3: The Cooling Source tab.
The Cooling Conditions tab will only appear on this page if the Create a Cooling Design Day option is selected on the Select Design Day Type page. From this tab, you will setup the external weather data to be used on the Cooling Design Day.
At the bottom of the tab is a table listing all of the possible design conditions. The table has the following columns:
Design Condition - This column lists the name of the design condition. For cooling conditions this will be annual and monthly conditions based on peak drybulb and wetbulb temperatures.
Drybulb - This column lists the peak external drybulb temperature to be used in the cooling calculation. Depending on the unit system selected in Tas, this will be displayed in Celsius or Fahrenheit.
Wetbulb - This column lists the peak external wetbulb temperature to be used in the cooling calculation. Depending on the unit system selected in Tas, this will be displayed in Celsius or Fahrenheit.
Coincident Drybulb Range - This column lists the coincident drybulb range used to create a day’s worth of drybulb temperatures as per table 6 of the 2017 ASHRAE Fundamentals Guide. Depending on the unit system selected in Tas, this will be displayed as a Celsius or Fahrenheit range.
Coincident Wetbulb Range - This column lists the coincident wetbulb range used to create a day’s worth of wetbulb temperatures as per table 6 of the 2017 ASHRAE Fundamentals Guide. Depending on the unit system selected in Tas, this will be displayed as a Celsius or Fahrenheit range.
TauB - This column lists the clear-sky optical depth for beam irradiance. This is used to generate a day’s worth of direct solar radiation values.
TauD - This column lists the clear-sky optical depth for diffuse irradiance. This is used to generate a day’s worth of diffuse radiation values.
Wind Speed - This column lists the external wind speed to be used in the cooling calculation. Depending on the unit system selected in Tas, this will be displayed in metres per second, foot per second or miles per hour.
Wind Direction - This column lists the external wind direction to be used in the cooling calculation. This will always be displayed in degrees from north; i.e. 0 is due north, 90 is due east.
Left clicking on a design condition will select the design condition. Once a design condition is selected, it’s row in the table is highlighted blue and the graph and table above the design condition table will be updated. Multiple design conditions can be selected by holding down the Ctrl key while making your selections.
On the graph: the green area plot relates to the global radiation values for the day, the blue area plot relates to the diffuse radiation values for the day and the red line graph relates to the external drybulb temperature for the day. The global and diffuse radiation plots use the axis on the left hand side of the screen, while the temperature plot uses the axis on the right hand side of the screen.
Underneath the graph there is a table detailing the global radiation, diffuse radiation and external drybulb temperature at each hour of the day. The graph and table will display in either SI metric or US customary units depending on which unit system Tas is currently using.