Other User Interface Elements
This section explains the use of the different parts of the TPD user interface, except the ribbon control.
Project Explorer Treeview
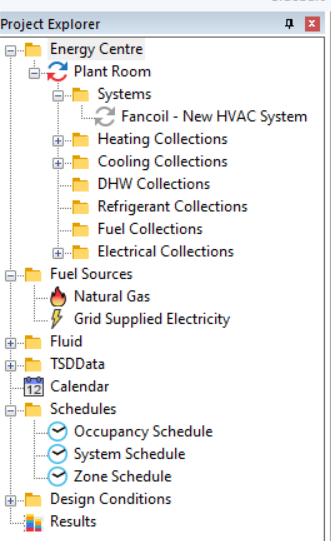
This lists the elements that make up the TPD file, in the same way as the TBD file treeview. Click on an element to edit it or navigate to it. Right click-on the folders to create new elements. Note that it is possible to create elements in other ways, e.g., airside systems can be added using the ribbon controls, or with the Systems Wizard (TPDx).
Results Table
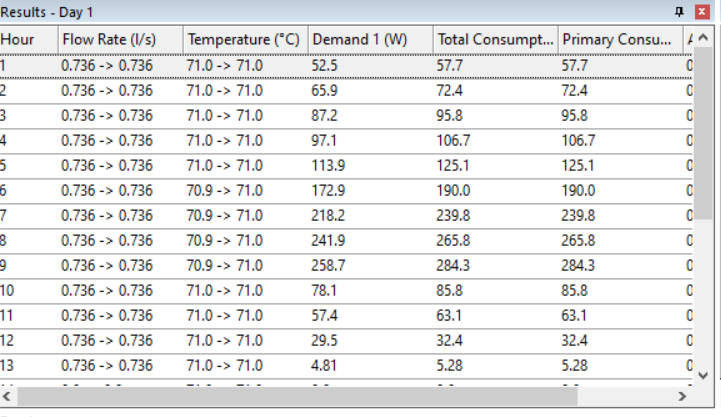
Results: Change which results series are visible.
Period: Used to change the time range for the currently-shown results. Depending on the type of result, values might be summed (e.g., for component load) or averaged (e.g., for air temperature) over the specified period.
Load Units: Used to toggle between, e.g., watts and kilowatts.
Precision: Used to change the number of decimal places displayed in the results.
Results Graph
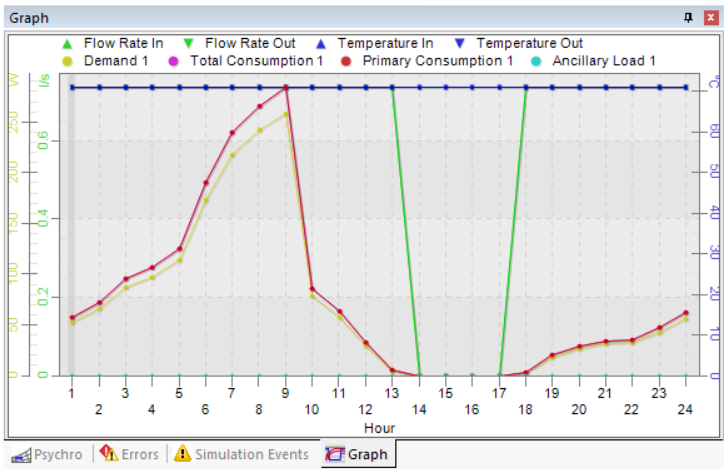
Displays the same data as the results table, but in a graphical format. Right-clicking opens a menu which gives the option to change the results series which are displayed, and also to export the graph as an image.
Errors and Warnings
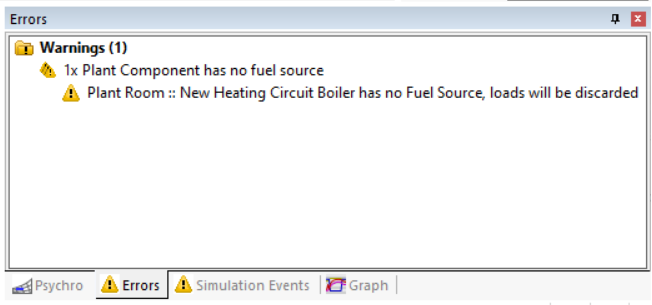
Error (Red octagon): You will not be able to simulate until this issue is resolved.
Warning (Yellow triangle): This input appears to be incorrect and you should not ignore this message unless it is something you have done intentionally.
Info (Blue circle): This input might be incorrect, and you should read and understand this message before proceeding.
Simulation Events
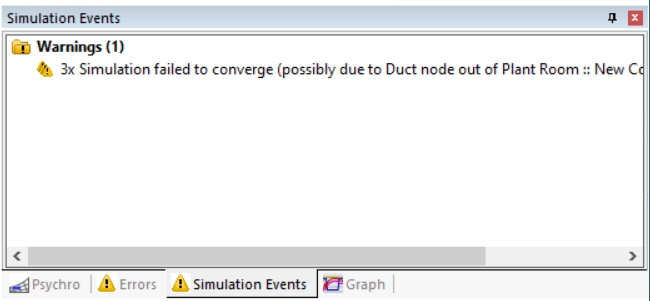
Error (Red octagon): The simulation failed.
Warning (Yellow triangle): This result appears to be incorrect, or the simulation failed to reach a steady state but was able to proceed.
Info (Blue circle): This result might be incorrect, and you should read and understand this message before proceeding.
Psychrometric Chart
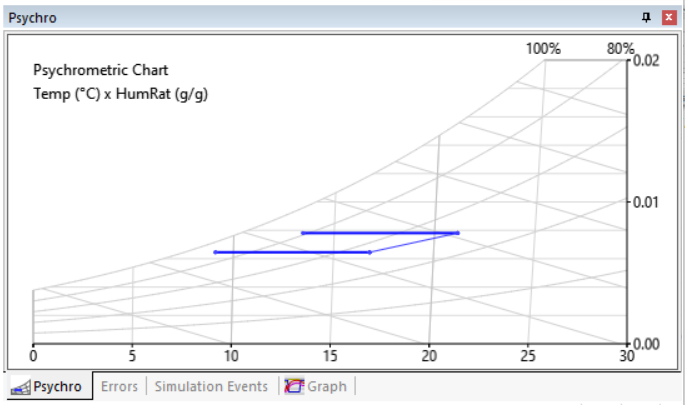
Displays a psychrometric chart for the currently-selected system, day and hour. The currently-selected component is displayed as a bold point or line, the other components as thin points or lines. Right-click to rotate or zoom, or to change the axis options.
Component Library
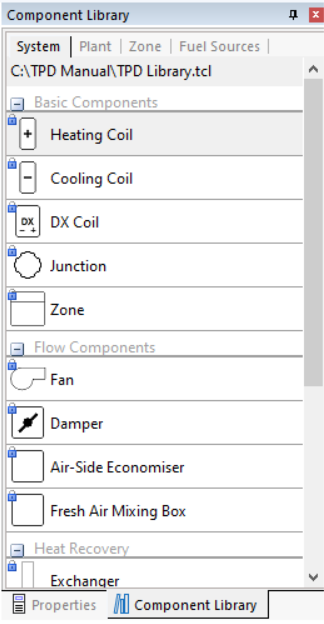
Displays all the components which can be drag-and-dropped into the schematic. Use the tabs to switch between plantroom components, air-side components, zone components, and fuel sources. The components are each explained in a different section of this guide.
Properties Sidebar
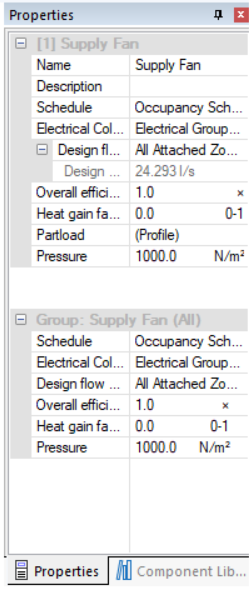
Displays the properties of the currently-selected component, and allows them to be edited. The components are each explained in a different section of this guide. If a component within a group is selected, the properties will be shown twice; firstly for the currently-selected instance of the component, secondly for all instances of this component within the group, allowing universal changes to be made.
Schematic
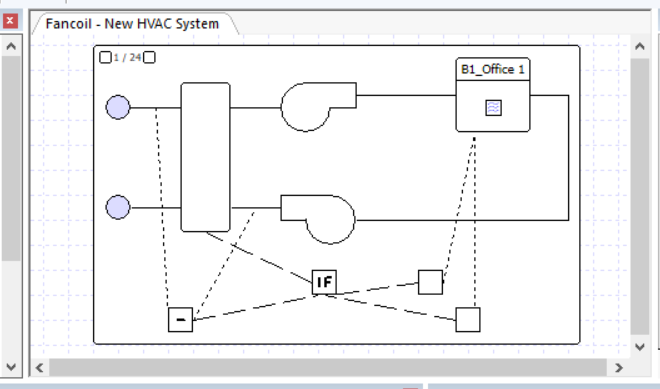
The window in which the currently-selected airside system or plantroom is viewed and edited. Click a component, duct, pipe, controller, or controller arc to select it, drag to move it. Double-click a component or controller to open the properties dialog. Use the mouse wheel or +- keys to adjust zoom level. To pan, use the arrow keys or hold down the middle mouse button and move the mouse.
Properties Window
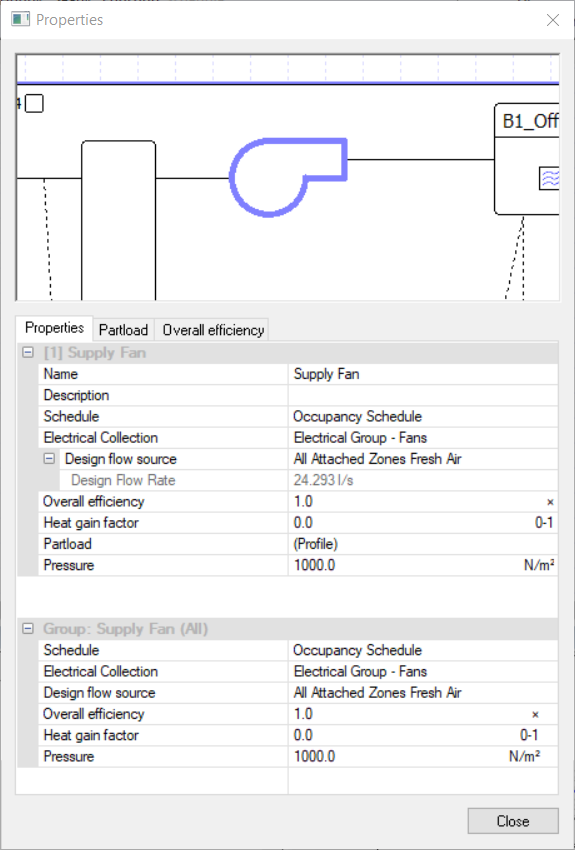
Displays the properties of the currently-selected component, and allows them to be edited. The components are each explained in a different section of this guide. The tabs show each of the properties which can be changed by the use of profile modifiers. If a component within a group is selected, the properties will be shown twice; firstly for the currently-selected instance of the component, secondly for all instances of this component within the group, allowing universal changes to be made.
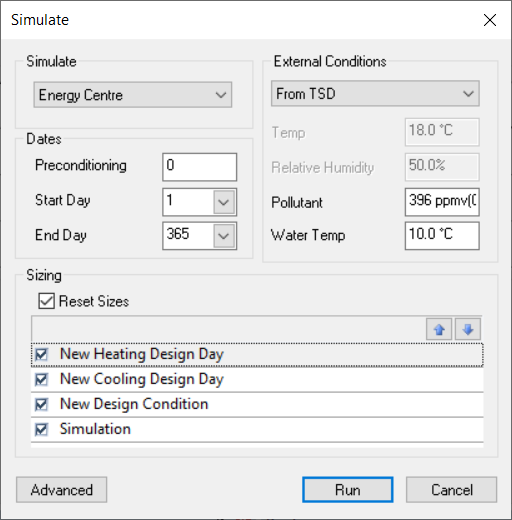
Simulate Dialog
Options
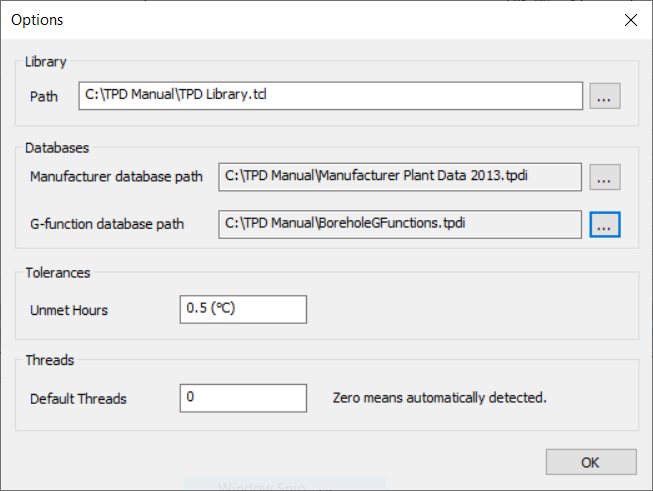
Accessed via the Ribbon under File: Options.