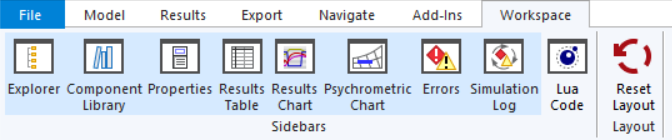
This section explains the use of the different parts of the TPD user interface, specifically the ribbon control.
The ribbon is found at the top of the TPD window. Each tab gives access to a different set of controls. Hover the mouse over the buttons on the ribbon to see explanatory tooltips. Note that many of these controls are duplicated elsewhere in the user interface.
Ribbon: File
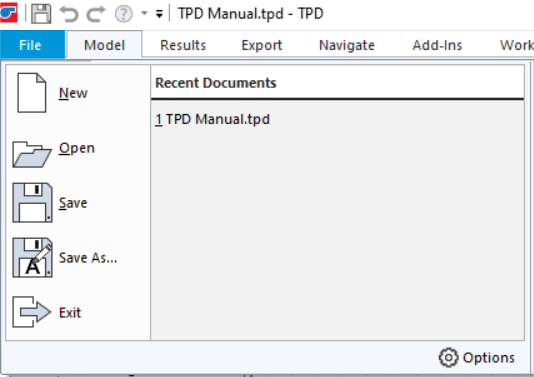
The File tab contains the normal commands for creating new files, opening existing files, and saving the current file. There is also a list of recently used TPD files, which can be opened by clicking on the file name shown in the list.
Ribbon: Model

Model Initialisation:
Project Wizard: Open the Tas Systems Wizard (TPDx).
Import TSD Data: Add a new TSD file’s data to the current TPD file.
Add Plant Room: Add a new plant room to the current Energy Centre.
Add System: Add a new airside system to the current plant room.
Library Components:
Use the options here to switch between tabs in the component library window.
Add Collections:
Use the options here to add new collections to the current plant room.
Fuel:
Add Fuel Source: Add a new fuel source to the current TPD file.
Fluid:
Add Fluid: Add a new fluid to the current TPD file.
Schedule:
Use the options here to add new schedules to the current TPD file.
Design Conditions:
Add DC: Add a new design condition to the current TPD file.
Select:
For copying and pasting components. Note that keyboard shortcuts exist for these commands:
Select All: Ctrl+A
Copy: Ctrl+C
Paste: Ctrl+V
Group Tools:
Note that Ctrl+G is the keyboard shortcut for grouping selected components.
Component Tools:
Add to library: Add the selected component or group to the component library.
View Properties: Open the properties window for the selected component or group.
Rotate Direction: Rotate the selected component or group.
Delete: Delete the selected component or group.
Zoom:
For adjusting the schematic view. The mouse wheel can also be used to adjust zoom level.
Simulate:
Errors: Display the error and warning window.
Run Simulation: Open the simulate dialog.
Ribbon: Results

Duct and Pipe View
Flow: Pipes and Ducts are shown thicker when flow result is higher on selected day and hour, thinner when flow result is lower.
Pressure: Pipe and Duct thickness varies with flow result as above. Pipes and Ducts coloured red for negative pressure result, green for positive pressure result.
Temperature: Pipe and Duct thickness varies with flow result as above. Pipes and Ducts coloured red for high temperature results, blue for low temperatures, and colour varies within the spectrum for intermediate values.
Results Display
Changes which results are visible in the results table for the selected component.
Time of Day
Used to select the day and hour for which results are currently being shown in the schematic, results table, graph, and psychrometric chart.
Reporting Period
Used to change the time range for the currently-shown results. Depending on the type of result, values might be summed (e.g. for component load) or averaged (e.g. for air temperature) over the specified period.
Display Options
Load Units: Used to toggle between e.g. watts and kilowatts.
Precision: Used to change the number of decimal places displayed in the results.
Copy Table to Clipboard: Copy the current results table so that it can be pasted into e.g. Excel.
Graph View Options
Used to customise the appearance of the results graph.
Labels
Add a label to the currently-selected component. This label can contain text or a result value which will change dynamically depending on the selected day, hour, and result period.
Results
Whole Bldg Results: Jump to the combined results chart for the Energy Centre.
Clear Results: Deletes all stored result data from the current plant room or airside system.
Ribbon: Export
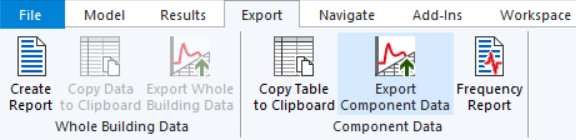
Whole Building Data
Create Report: Opens the Report Generator Wizard. User can create one of the following reports:
System and Plant Component Sizing: Output data showing flow and duty sizing of all components.
Systems Air-Side: Produce a report including images, component properties, and results grouped by component type for the air-side systems.
Systems Simulation Results: Produce a report displaying charts for a range of parameters, including consumption, demand, cost and carbon emissions.
Systems Water-Side: Produce a report including images, component properties, and results grouped by component type for the plantrooms.
NB: Reports cannot be created for a TPD file that has not yet been saved. To enable this button, save the TPD file.
Copy Data to Clipboard: When the whole-building results chart is being viewed, this button can be used to copy the results values to the clipboard.
Export Whole Building Data: When the whole-building results chart is being viewed, this button copies an image of the chart to the clipboard.
Frequency Report: The user selects components which have simulated results, and can then choose to see the number of hours in which a chosen result meets certain parameters, in a similar way to the TSD frequency report. For example, this could be used to show the number of hours in which cooling coil loads exceeded a specified value.
Component Data
Copy Table to Clipboard: When a component is selected, this button copies the results values to the clipboard.
Export Component Data: When a component is selected, this button copies an image of the results graph to the clipboard.
Ribbon: Navigate

Model Data
Building Simulator: Opens the TBD file associated with the currently-selected TSD Data.
Results Viewer: Opens the TSD file associated with the currently-selected TSD Data.
Nav to TSDData: Selects the TSDData folder in the project explorer treeview.
Project Explorer: Each button selects the relevant folder in the project explorer treeview.
Components
Use the options here to switch between tabs in the component library window.
Results
Use the options here to select the named UI elements.
Checking
Errors: Select the errors and warnings window.
Simulation Log: Select the Simulation Events window.
Ribbon: Add-Ins
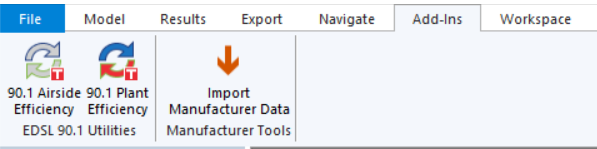
EDSL 90.1 Utilities:
90.1 Airside Efficiency: Opens the tool to automatically calculate fan power and exchanger efficiency according to 90.1 baseline building requirements.
90.1 Plant Efficiency: Opens the tool to automatically calculate efficiencies for boilers, chillers, and heat pumps according to 90.1 baseline building requirements.
Manufacturer Tools
Import Manufacturer Data: Import component performance tables from a TPDI file. Note that all plant rooms in the Energy Centre must contain results in order to run this tool.