3D Visualisation
The 3D Visualisation is a very useful tool in the Building Simulator, which can be used to display the building geometry and model information visually. The visualisation can also show information such as:
Solar surface exposure
Sun arcs/analemmas
Location of assigned constructions/internal conditions etc
To open the visualisation window, click on 3D Visualisation in the 3D Visualisation ribbon tab:
Camera Controls
You can control the view of the model in the visualisation using a combination of mouse movements & keyboard keys.
To Pan the model, hold the Middle Mouse Button and move the mouse:
Panning the view
To Rotate the model, hold the Middle Mouse Button and hold Shift whilst moving the mouse:
Rotating the view
To zoom in and out, you can Scroll the mouse wheel.
There are also some ribbon options to help you control the camera position:

The Camera Position dialog is useful for explicitly specifying camera positions for use generating consistent images for presentations & reports.
Locating Entities
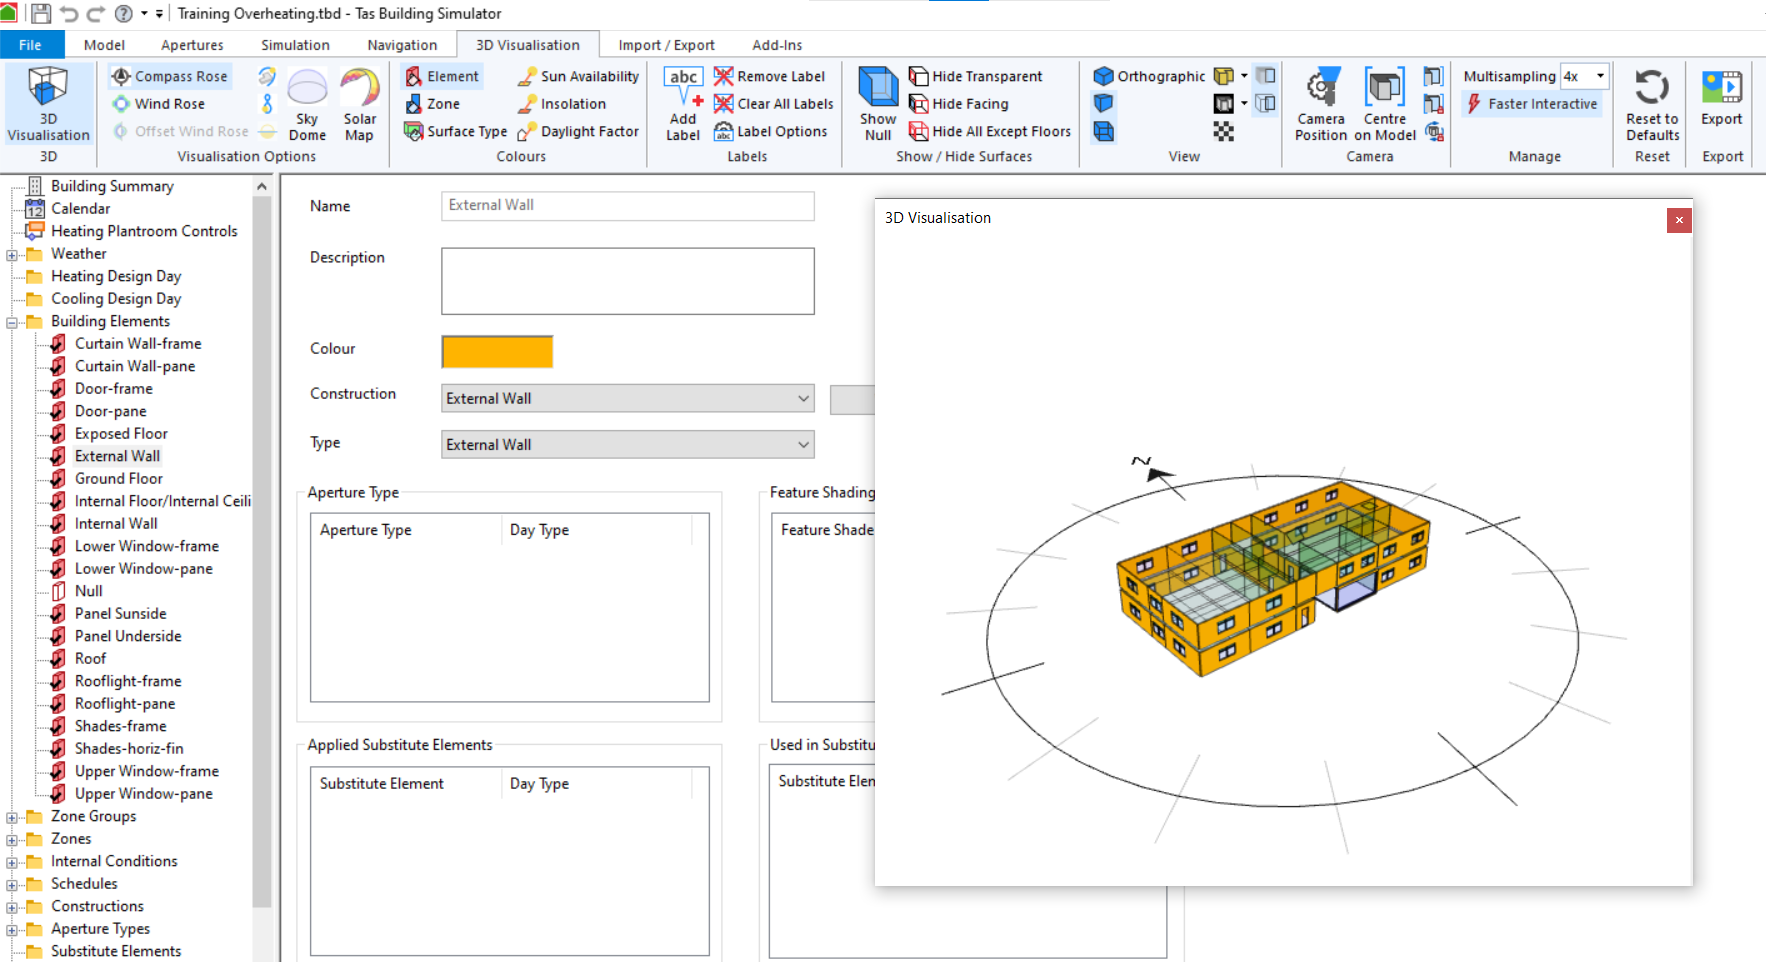
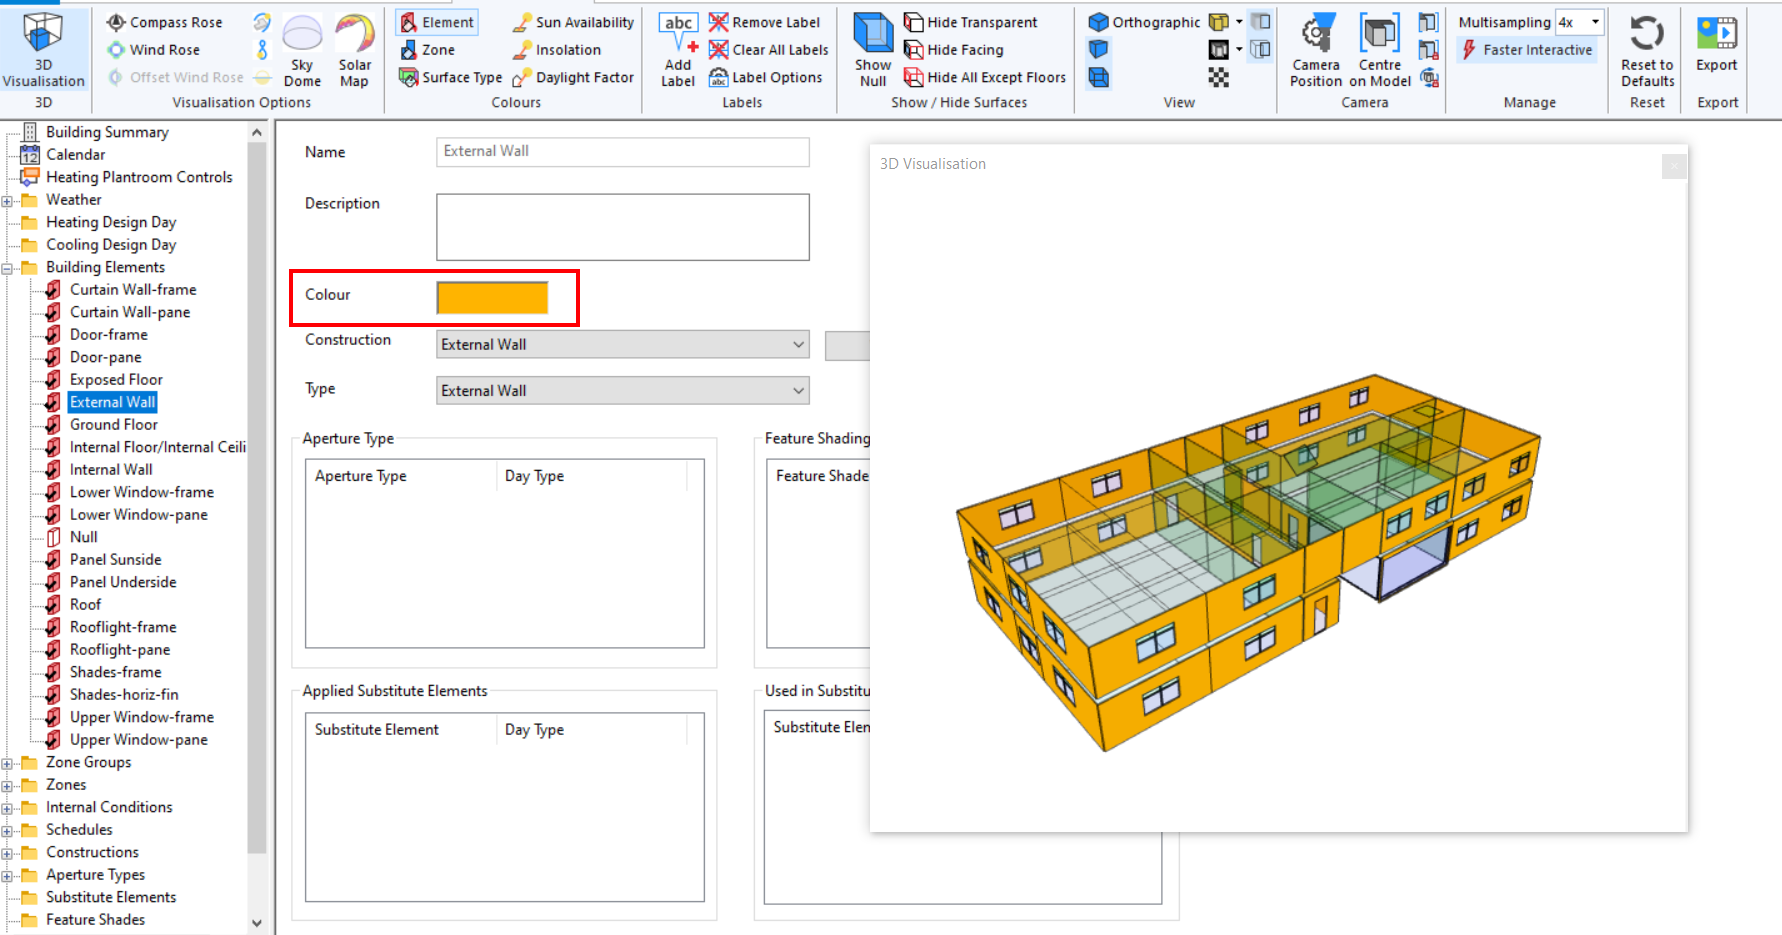
By clicking on individual entities in the tree view such as Building Elements, Zones, Internal Conditions, Constructions, Apertures etc, the visualisation will update to show you where instances of those entities have been used.
For example, by clicking on the External Wall building element, the visualisation updates to highlight any surfaces which have that building element applied:
Tip
This can be useful for ‘sanity checking’ models - by clicking on a zone in the list, you can quickly check that each zone has been assigned to only one non-contiguous space. By clicking on the roof construction, you can quickly check that it hasn’t been assigned to walls/floors/windows by mistake.
Visualisation Options
The following visualisation options can be accessed via the relevant section of the ribbon, or by right clicking on the visualisation and clicking More Display Options.
Compass Rose
Toggling the compass rose option draws the north arrow on the visualisation window.
Wind Rose
Turning on the wind rose option draws a rose around the building in the visualisation showing the magnitude and direction of the wind throughout the year:
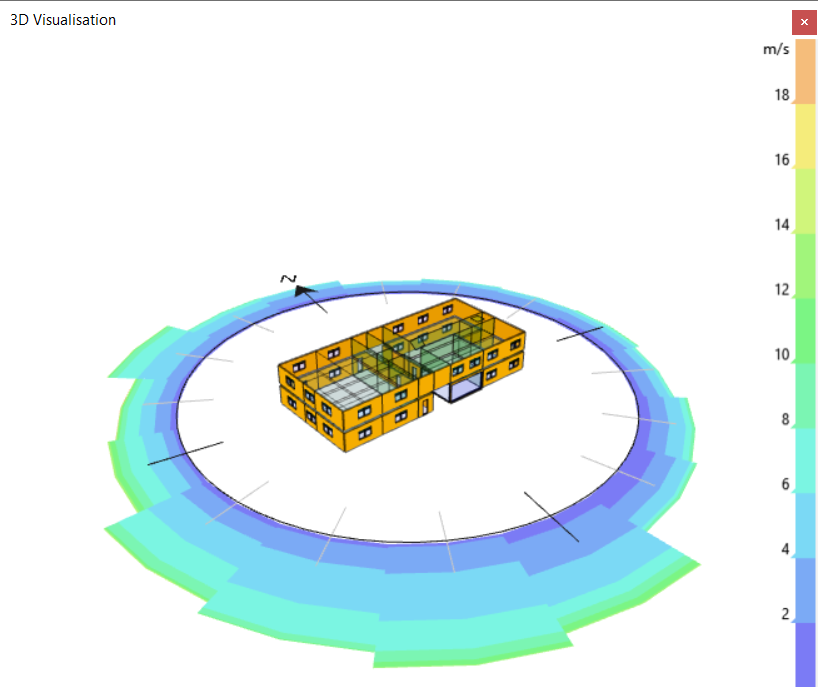
This can be useful for designing an efficient natural ventilation strategy for a building.
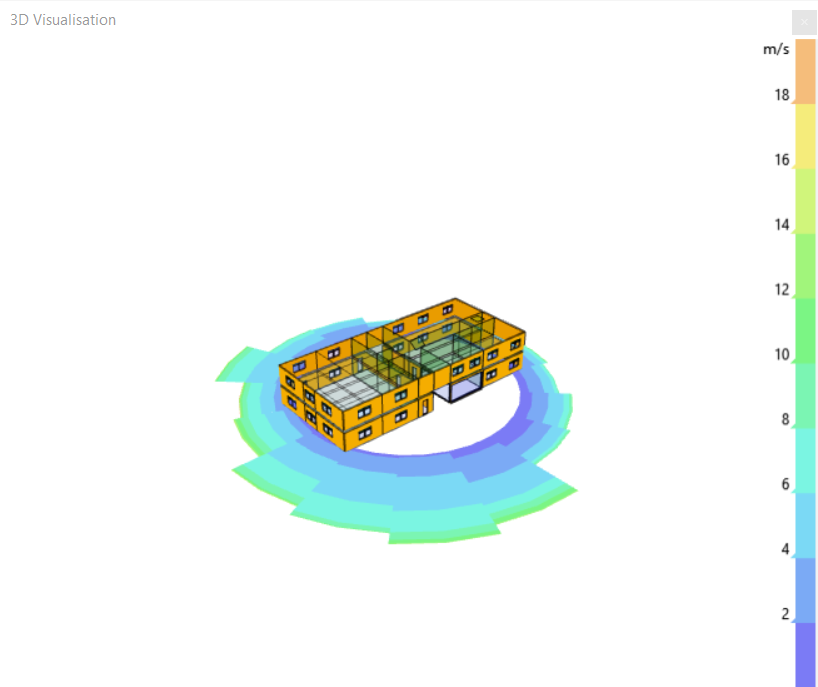
Offset Wind Rose
This option affects where the wind rose will be drawn; if it is on, the wind rose will be drawn outside the compass. If it is off, it will be drawn next to the building:
Sun Arcs
The Sun Arcs option draws curves indicating the positions the sun can adopt throughout the year, depending on the time of year and time of day:
This can be useful for understanding the solar gain and daylight the zones and surfaces can experience throughout the year.
Sun Analemmas
The Sun Analemmas option shows the positions of the sun at the same time of day throughout the year.
Again, this can be useful for understanding the solar impact on zones and surfaces throughout the year.
Sky Dome
The Sky Dome option can be used to draw a mesh representing where the sky is in the visualisation. The sun arcs and analemmas will appear somewhere on this mesh.
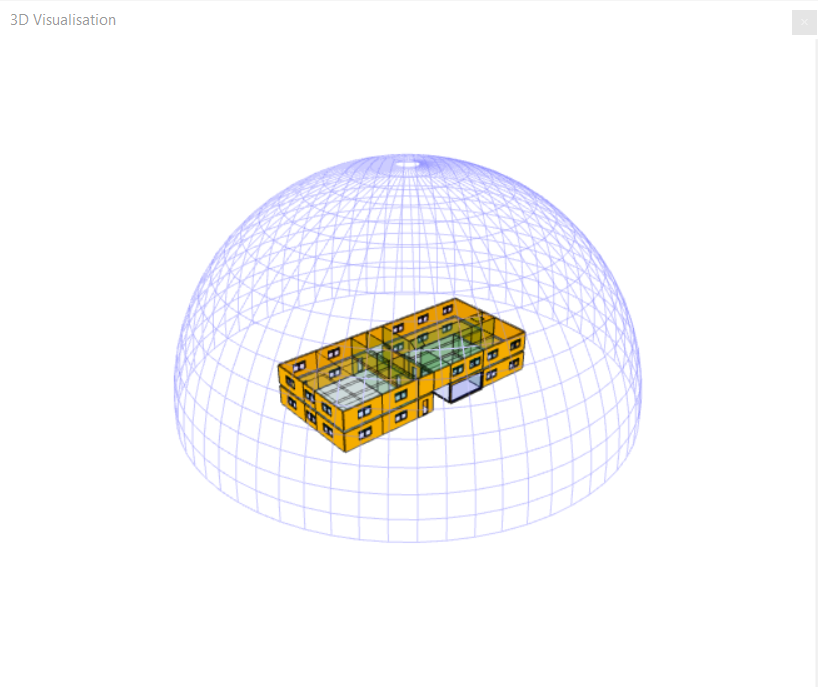
This option can improve the appearance of the visualisation when used in conjunction with the Solar Map.
Solar Map
The Solar Map option shows the intensity of the solar radiation from the sun for each of the sun positions in the sky throughout the year.
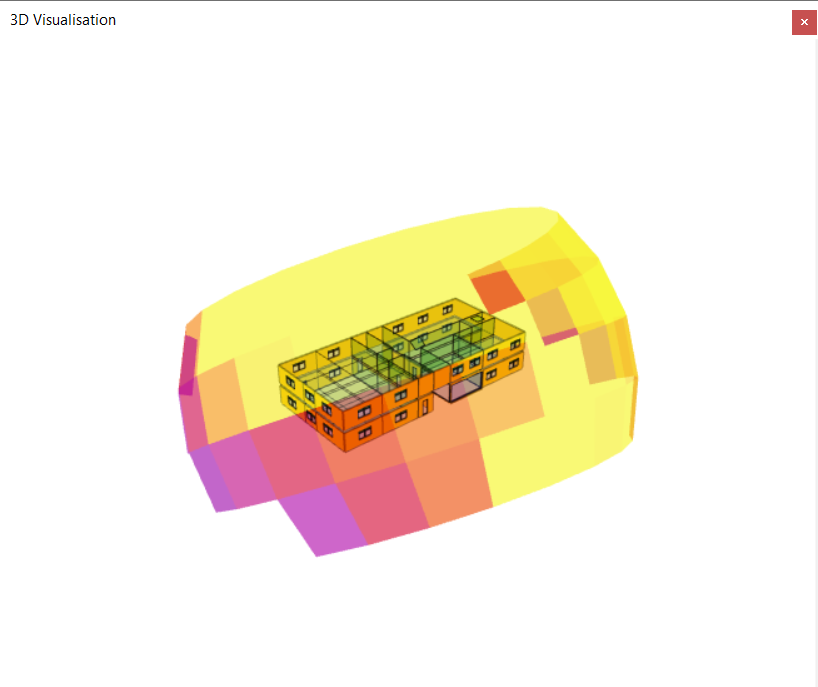
This can be useful for optimising the design of a building so that shading is most effective when the sun is strongest, for example.
Display Colours
You can choose the meaning of the colours used to draw the surfaces in the visualisation by changing the Display Colour options in the ribbon.
Element
This option colours the surfaces according to their Building Element. The colour each Building Element has is a property of that Building Element:
Zone
This option colours the surfaces according to the zone colour to which the surface belongs, which is a property of that zone:
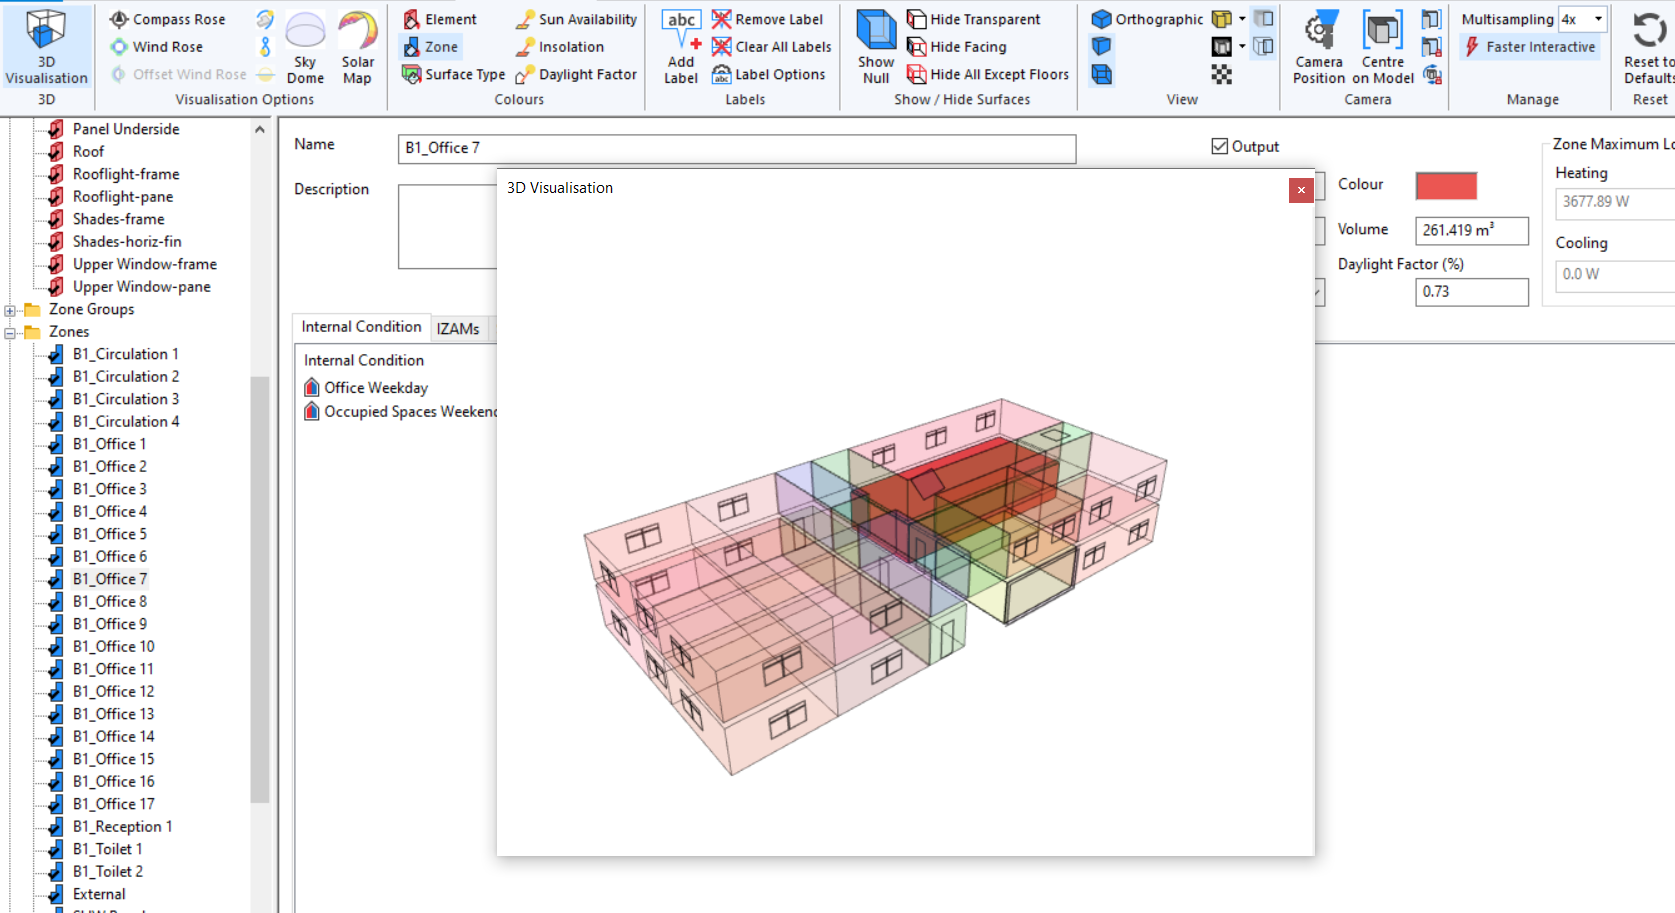
This colour originally comes from the colour assigned in the 3D modeller for that zone.
Surface Type
This option colours the surfaces according to their surface type. The surface types are:
Ground
Exposed
Adiabatic
Link (to another surface)
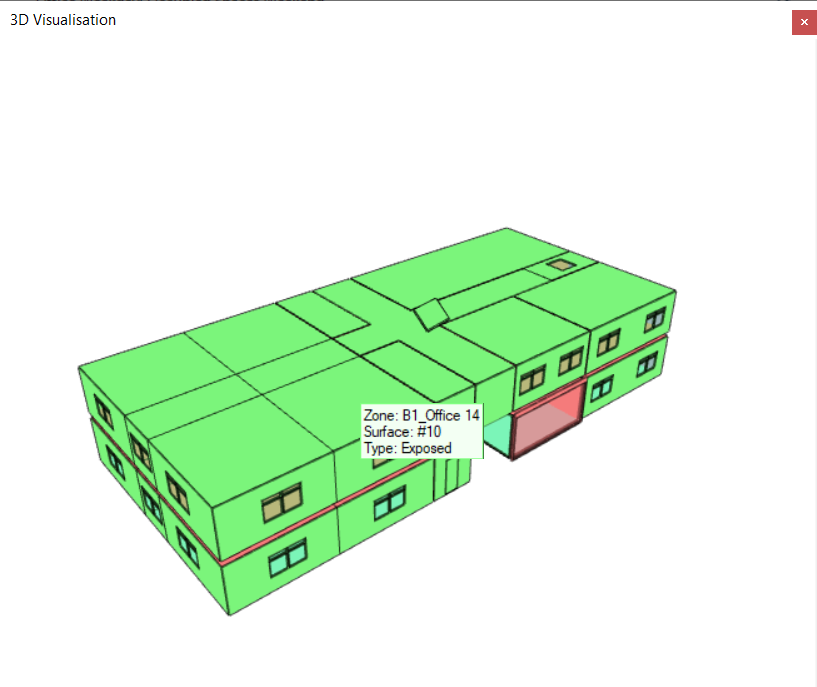
This option is very useful for quickly identifying exposed surfaces.
Sun Availability
This option colours the surfaces according to the percentage of the surface that is exposed to direct sunlight:
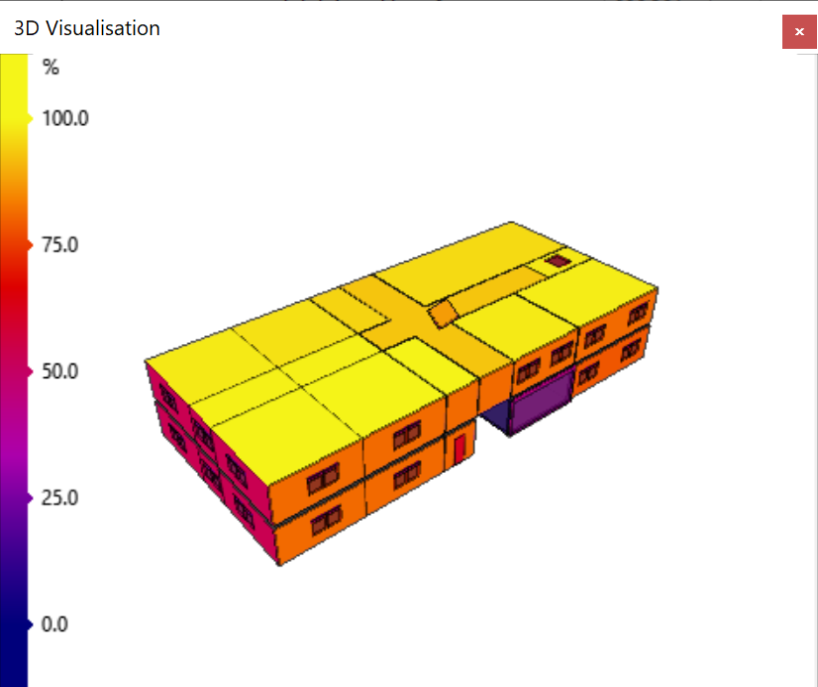
This can be useful for visualising how much of a surface is in shade.
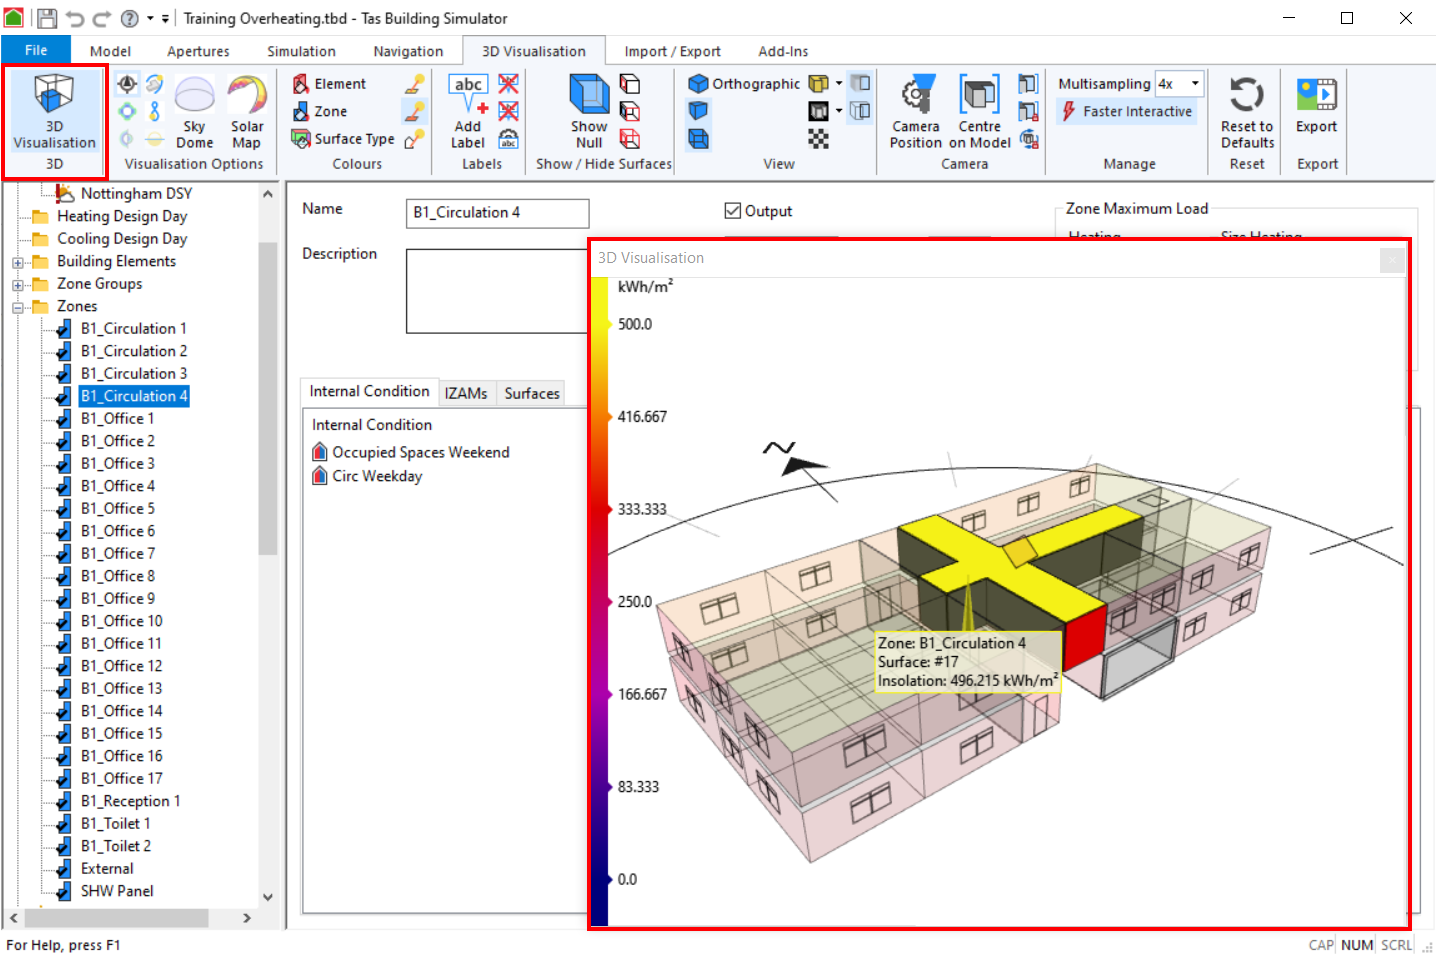
Annual Solar exposure
This option colours the surfaces according to the amount of direct solar energy the surfaces are exposed to, annually:
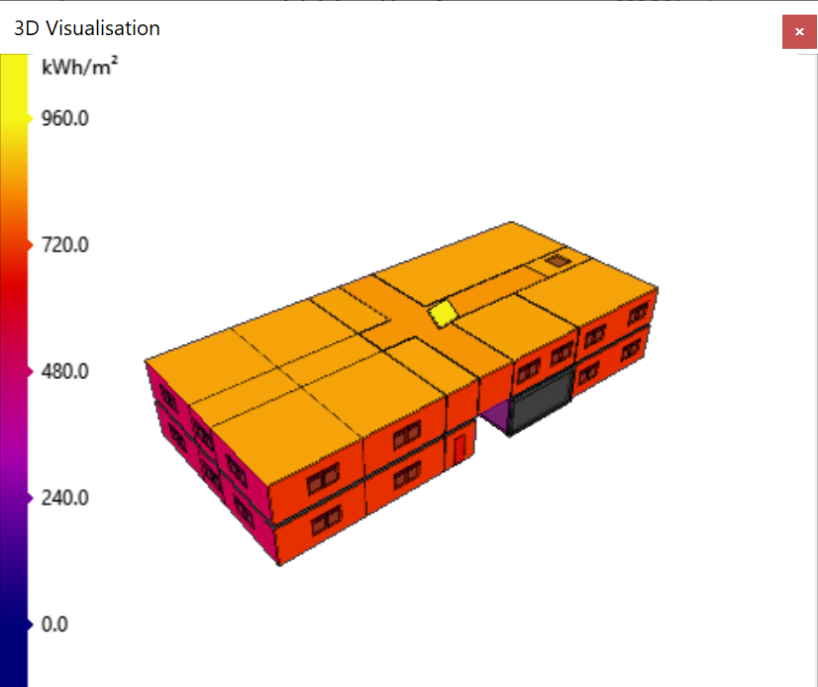
In the above image, the surface on the roof of the model representing the solar panel has maximal annual solar exposure which is desirable.
Daylight Factor
This option colours the surfaces according to the daylight factor of the zone the surface belongs to. The daylight factor is found in the zone properties page:
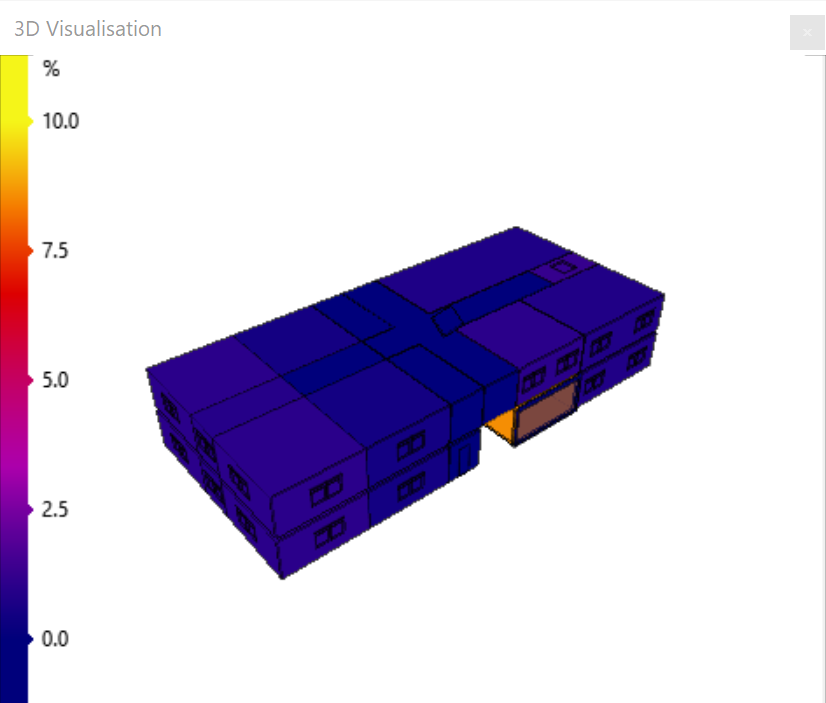
You can calculate daylight factors using the 3D modeller, or using the BRE tool in the building simulator. For more information, see BRE Daylight Factors.
Labels
You can add labels to surfaces in the visualisation to display information about the surface. This is useful for generating images for reports.
To add a label, press the Add Label button in the ribbon:
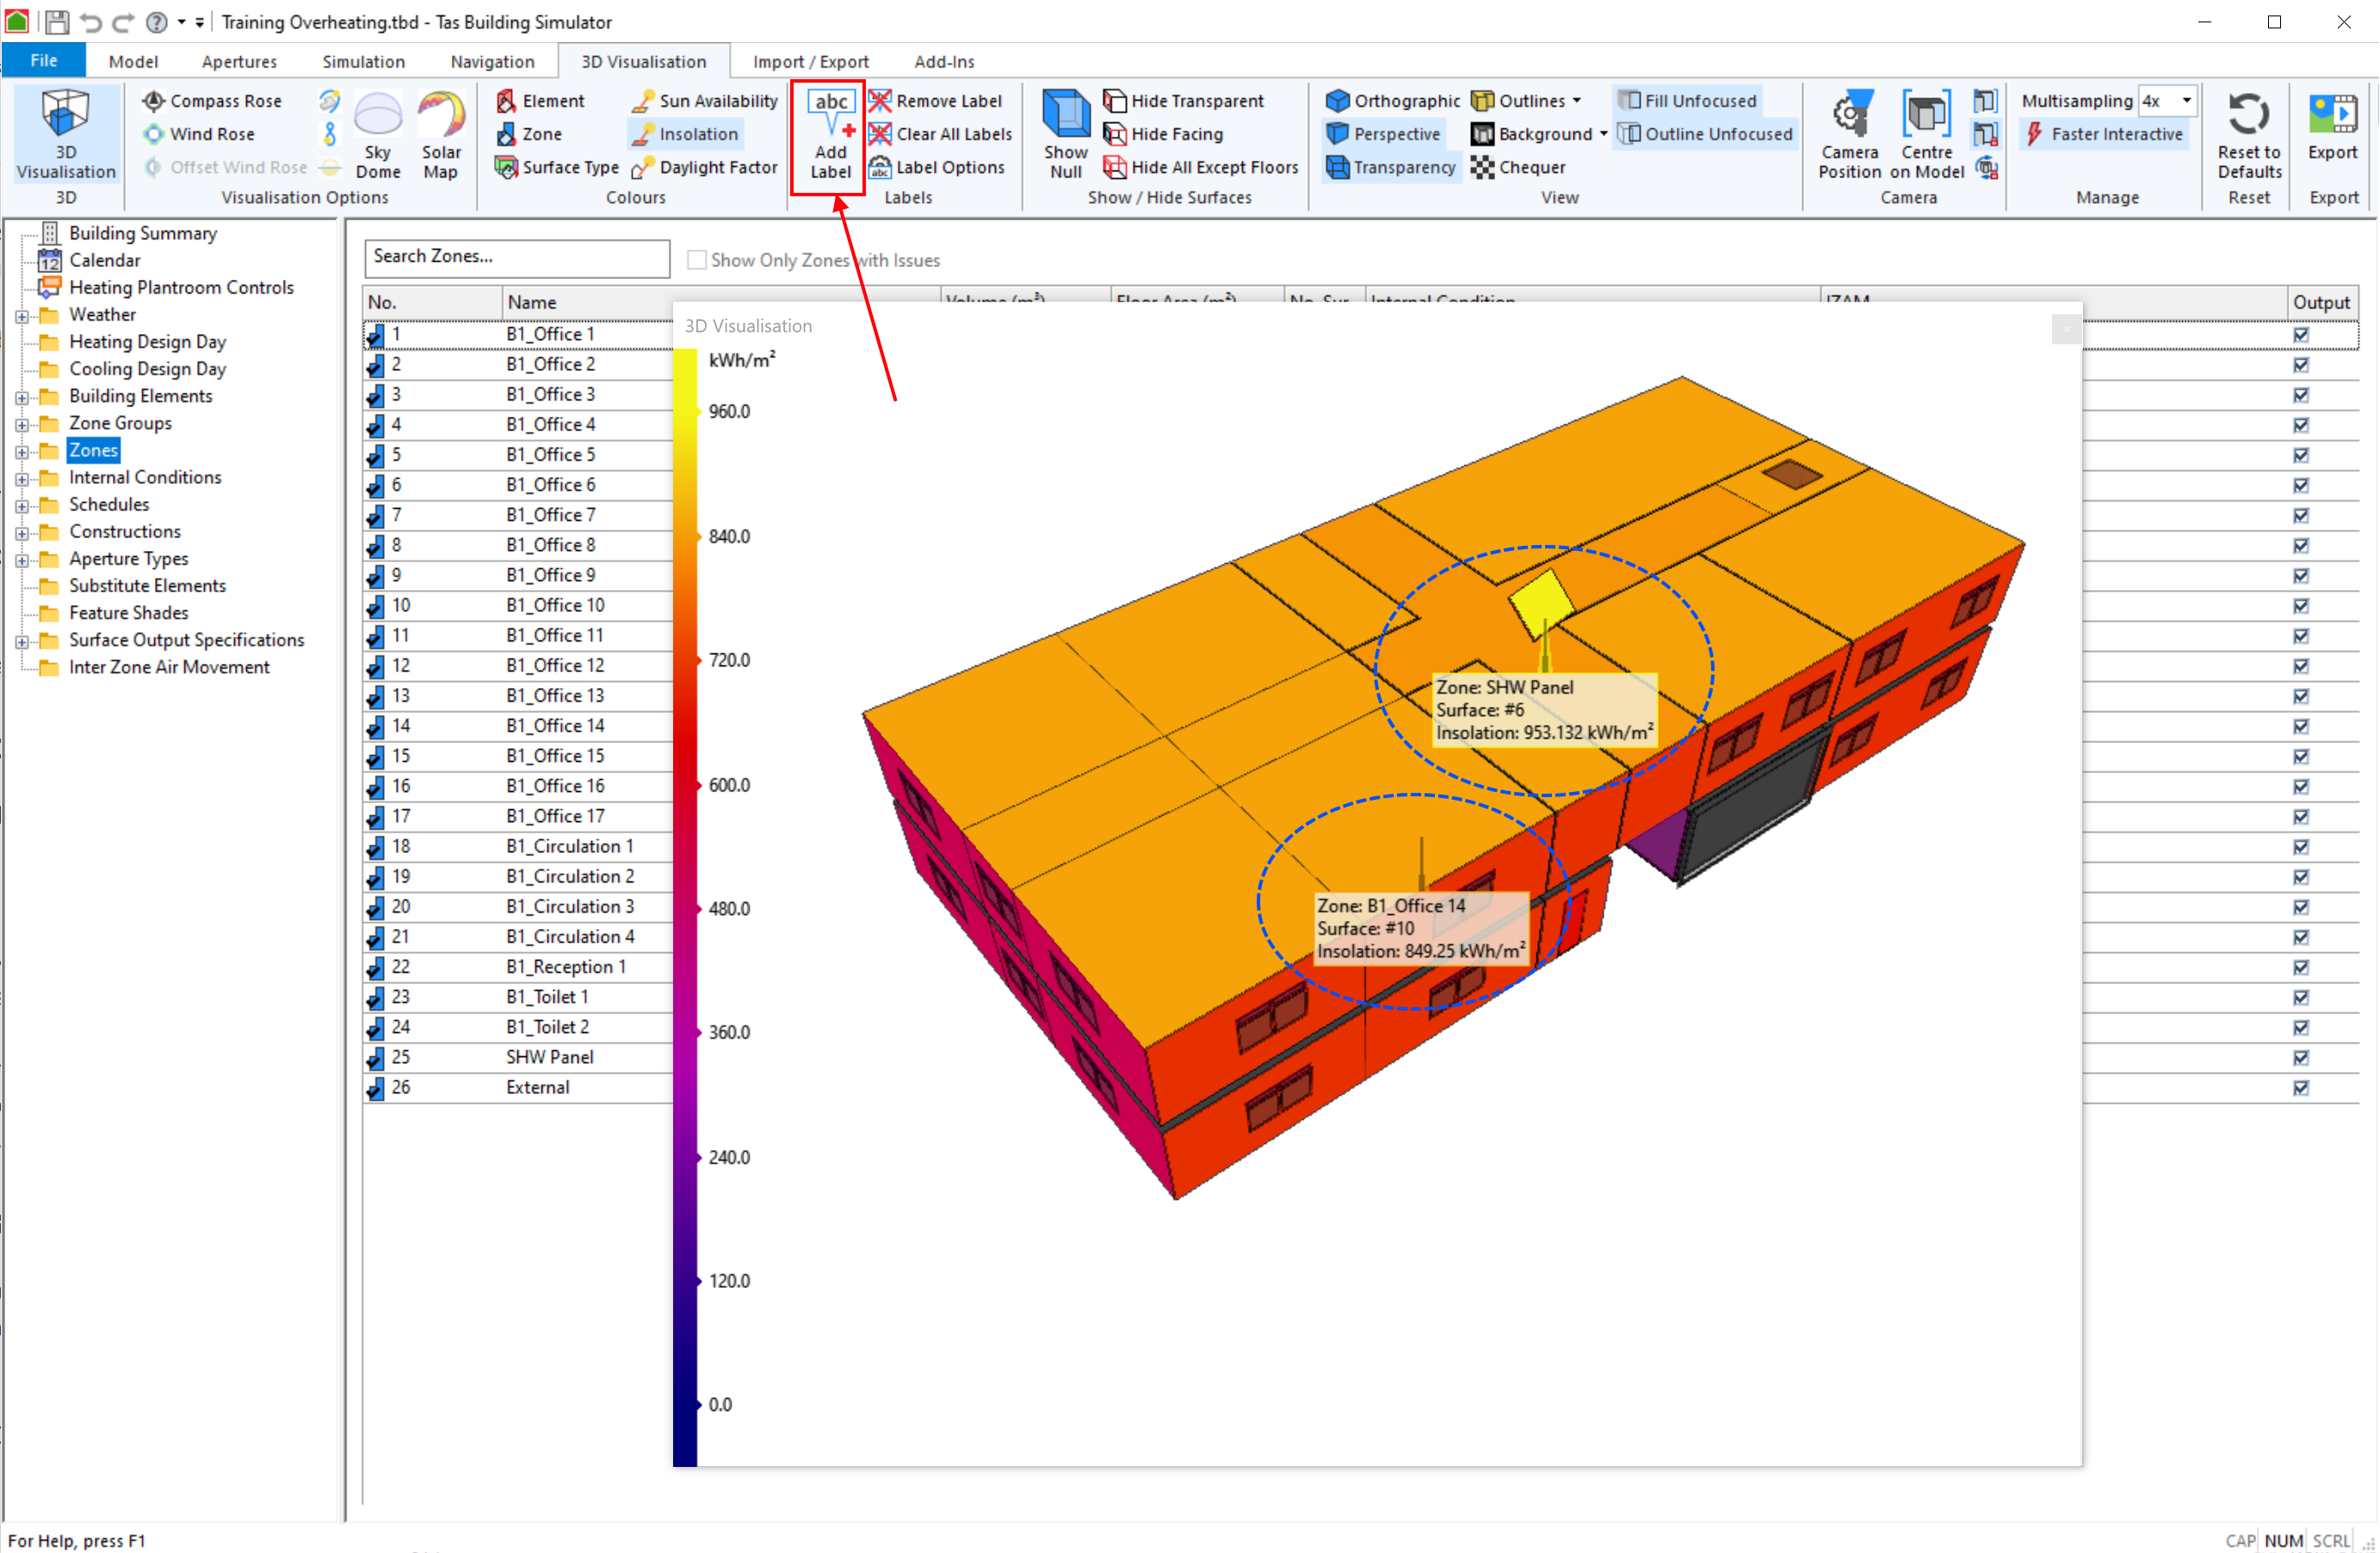
You can configure the Label Options in order to choose which information is included in the labels. The options are:
Surface Number
Building Element
Surface Type
Displayed data (e.g. Insolation)
Export
The Export button in the 3D Visualisation section of the ribbon allows you to generate images and videos from the visulisation.
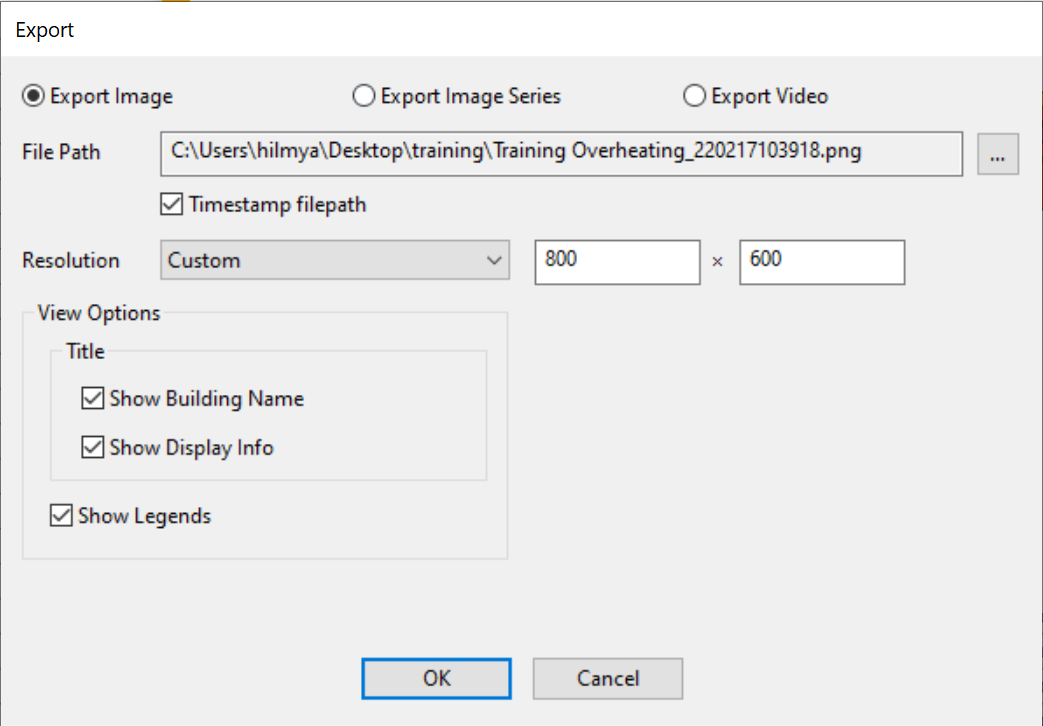
The Export Image Series allows you to automatically generate a sequence of images of the model being orbited.
Tip
The Export Image Series feature produces a series of images you can turn into an animated gif
The Export Video option allows you to generate an AVI video file showing the model being orbited.
Tip
Add labels to your visualisation before generating images & videos to convey useful information.